الطقس ضد المناخ: كيف نميّز الضجيج من الإشارة سريع
في الشتاء، قد تتساقط في أحد أحياء المدينة ثلاثة أضعاف كمية الثلوج التي تتساقط في الحي المجاور. سنة حارة، وأخرى باردة. هذه نزوات الطقس. لكن على مدى عقود، نلاحظ تحوّلاً آخر بطيئاً: فمتوسط فصول الشتاء يصبح أكثر اعتدالاً. التمييز بين الأمرين هو المهمة الأساسية لعلماء المناخ.
في الدراسة الجديدة، يُقترح حساب مقدار التقلبات العشوائية في بيانات درجات الحرارة أو هطول الأمطار، ومقدار التغيّر المستقرّ. ويستخدمون نماذج حاسوبية تُشغَّل عدة مرات بشروط ابتدائية مختلفة قليلاً، مما يعطي مجموعة واسعة من السيناريوهات المناخية المحتملة. ثم يقارنون التشتت بين هذه السيناريوهات مع التحوّل الناجم عن التأثير الخارجي، مثل زيادة ثاني أكسيد الكربون.
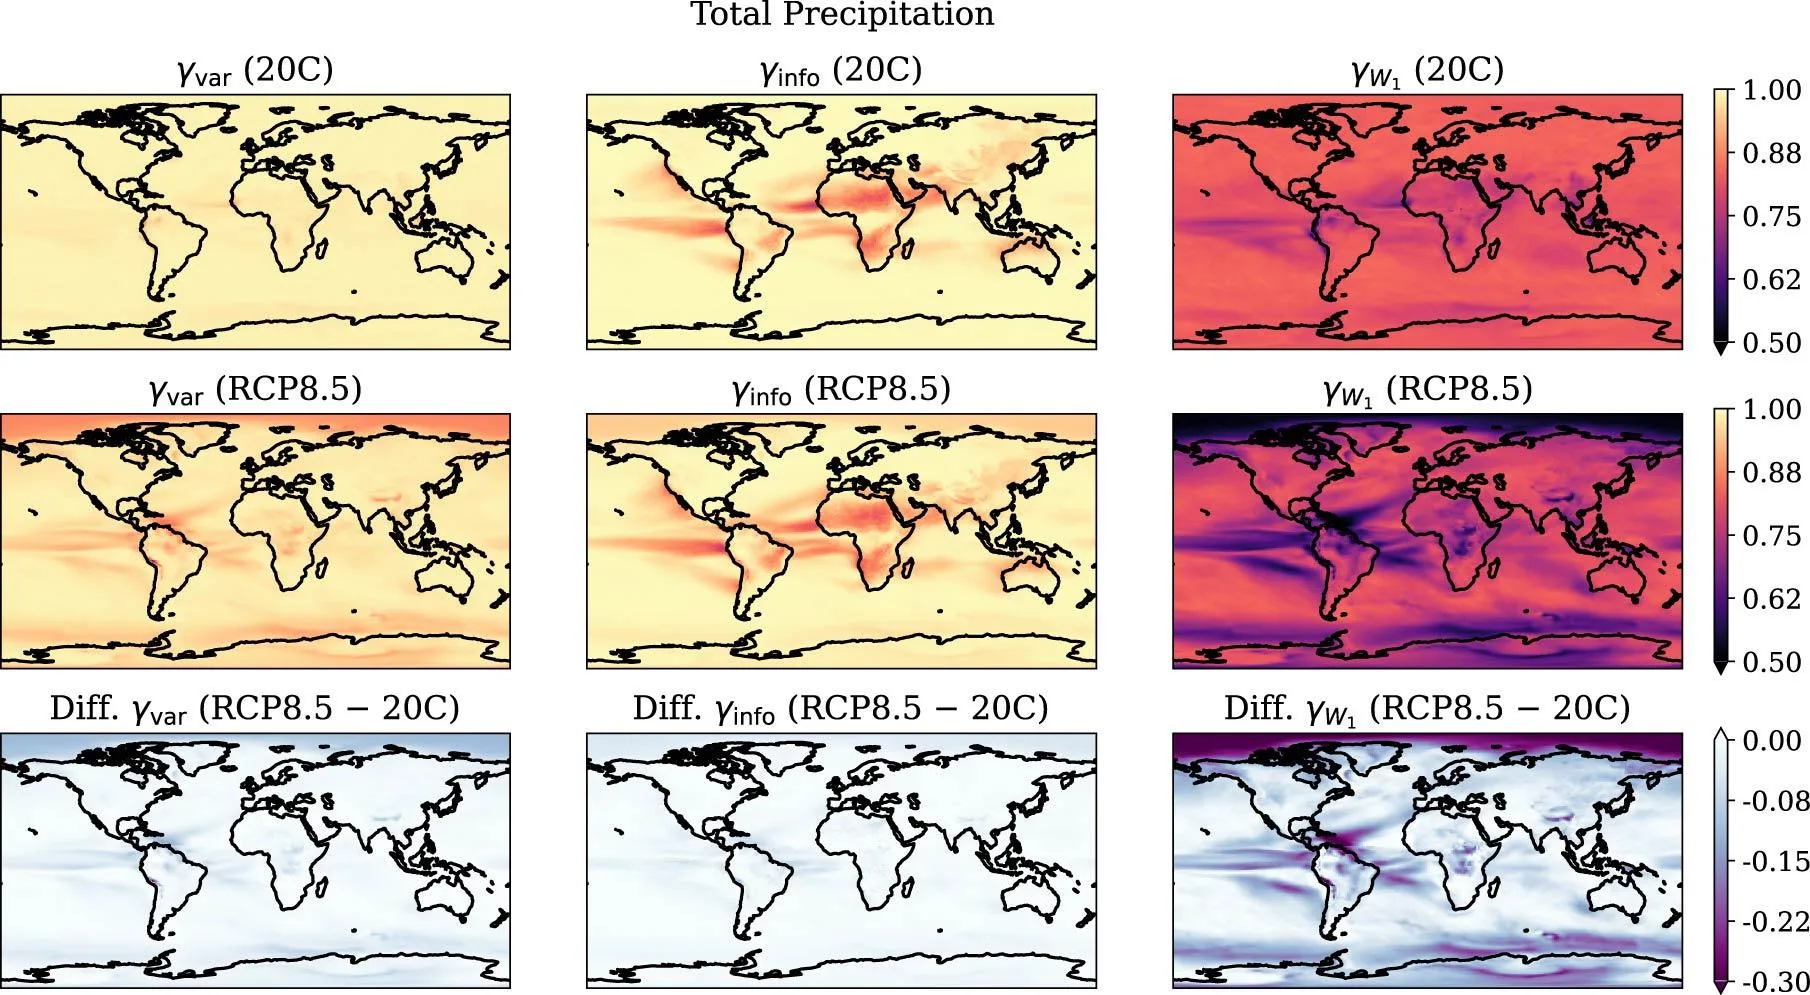
اتضح أن الطريقة الجديدة تعمل بشكل أكثر موثوقية من الطرق السابقة، حتى عندما تكون البيانات "مبعثرة" بشدة أو تحتوي على قيم متطرفة نادرة. المهم أن لا يقل عدد سيناريوهات الحساب في المجموعة عن أربعين. وعندما يشتد التأثير، تنخفض حصة العشوائية، ويظهر ذلك بوضوح خاص.
هذه الأداة تساعد على فصل الغث عن السمين: فهم ما هو ناتج حقاً عن النشاط البشري في التوقعات المناخية، وما هو مجرد تباين طبيعي، مثل تساقط ثلوج غير متوقع في مايو.
الملخص الأصلي
كما كتبه المؤلفون، بالإنجليزية arXiv:2608.14455v1
Quantifying forced and internal variability in climate data is fundamental to detecting the climate change signal and assessing uncertainty in climate projections. We propose a metric that quantifies the relative magnitude of internal variability in single-model initial-condition large ensembles (SMILEs). We measure forced and internal variability by two 1-Wasserstein distances, a form of optimal transport cost. The proposed metric is the distance for internal variability divided by the sum of the two. Computing this ratio requires only sorting the samples and differencing the resulting quantiles, with no additional parameters. The metric reflects the entire distribution shape and applies to non-Gaussian variables, because the 1-Wasserstein distance quantifies the difference between any two probability distributions. We validate the metric with synthetic climate data from Gaussian, uniform, and lognormal distributions. Unlike the two existing metrics, the proposed metric gives stable estimates irrespective of the distribution shape and the presence of outliers, provided that the ensemble has about 40 members or more. We then apply the proposed and existing metrics to the 2 m air temperature and total precipitation of the Community Earth System Model Large Ensemble (CESM-LE) under two different forcing scenarios. All the metrics indicate that the relative contribution of internal variability decreases as the forcing increases, but the proposed metric shows this response most clearly. The 1-Wasserstein distance thus provides a simple and useful tool for analyzing large-ensemble datasets.
في أحد سيناريوهات المحاكاة، كان الاحترار قوياً لدرجة أن التقلبات العشوائية في درجات الحرارة كادت أن تتوقف عن التأثير على الصورة العامة — فأصبحت إشارة تغيّر المناخ واضحة.