Турбулентность в космосе: как облака меняют химию звёзд экспресс
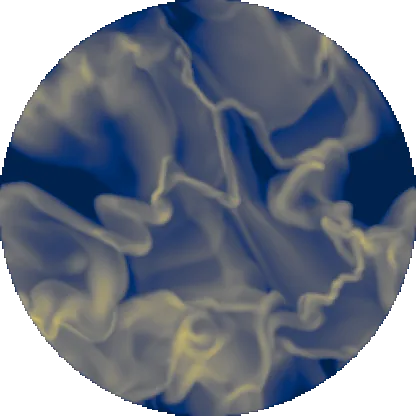
Кипящий котёл: пар поднимается, вода бурлит, и температура в разных точках разная. Так и в космосе: облака газа вокруг молодых звёзд не гладкие шары, а бурлящая смесь с вихрями и перепадами плотности. Астрономы долго считали такие облака однородными, но это упрощение может искажать выводы.
Учёные построили компьютерную модель облака вокруг одиночной горячей звезды — с турбулентностью и без. Оказалось, что вихри напрямую влияют на яркость линий излучения: линия азота [N II] становится ярче, линия кислорода [O III] — тусклее. Это сбивает оценки металличности (сколько в газе тяжёлых элементов) и других свойств. Ошибка достигает 0.1 dex — как если бы вы взвешивали сахар на весах, которые всегда врут на 20%.
Разница видна и в плотности: инфракрасные, оптические и ультрафиолетовые индикаторы дают разные числа для одного и того же облака. Это как измерять рост человека разными линейками — каждая показывает своё. Для точных выводов нужны большие таблицы моделей с турбулентностью, которые охватят условия и в близких, и в далёких галактиках.
Оригинальная аннотация
как её написали авторы, на английском arXiv:2602.02949
Reliable nebular emission line diagnostics are essential for accurately inferring the physical properties (e.g. electron temperature, density, pressure, and metallicity) of H II regions from spectra. When interpreting spectra, it is typical to adopt a single zone model, e.g. at fixed density, pressure, or temperature, to infer H II region properties. However, such an assumption may not fully capture the complexities of a turbulent interstellar medium. To understand how a complex density field driven by supersonic turbulence impacts nebular emission lines, we simulate 3D H II regions surrounding a single O star, both with and without supersonic turbulence. We find that turbulence directly impacts the values of common strong line ratios. For example turbulent H II regions exhibit systematically higher [N II]/H$$\alpha$$, lower [O III]/H$$\beta$$, and lower O32, compared to homogeneous H II regions with the same mean density and ionizing source. These biases can impact inferences of metallicity, ionization parameter, excitation, and ionization source. For our choice of turbulence, direct $$T_e$$ method metallicity inferences are biased low, by up to 0.1 dex, which is important for metallicity studies, but not enough to explain the abundance discrepancy problem. Finally, we show that large differences between measured electron densities emerge between infrared, optical, and UV density indicators. Our results motivate the need for large grids of turbulent H II regions models that span the range of conditions seen at both high and low redshift to better interpret observed spectra.
Турбулентность в межзвёздном газе может быть вызвана взрывами сверхновых — ударные волны перемешивают газ, как ложка размешивает сахар в чае.