Two Windows into One House: How Fiber Aperture Reshapes the Galaxy Portrait ✛
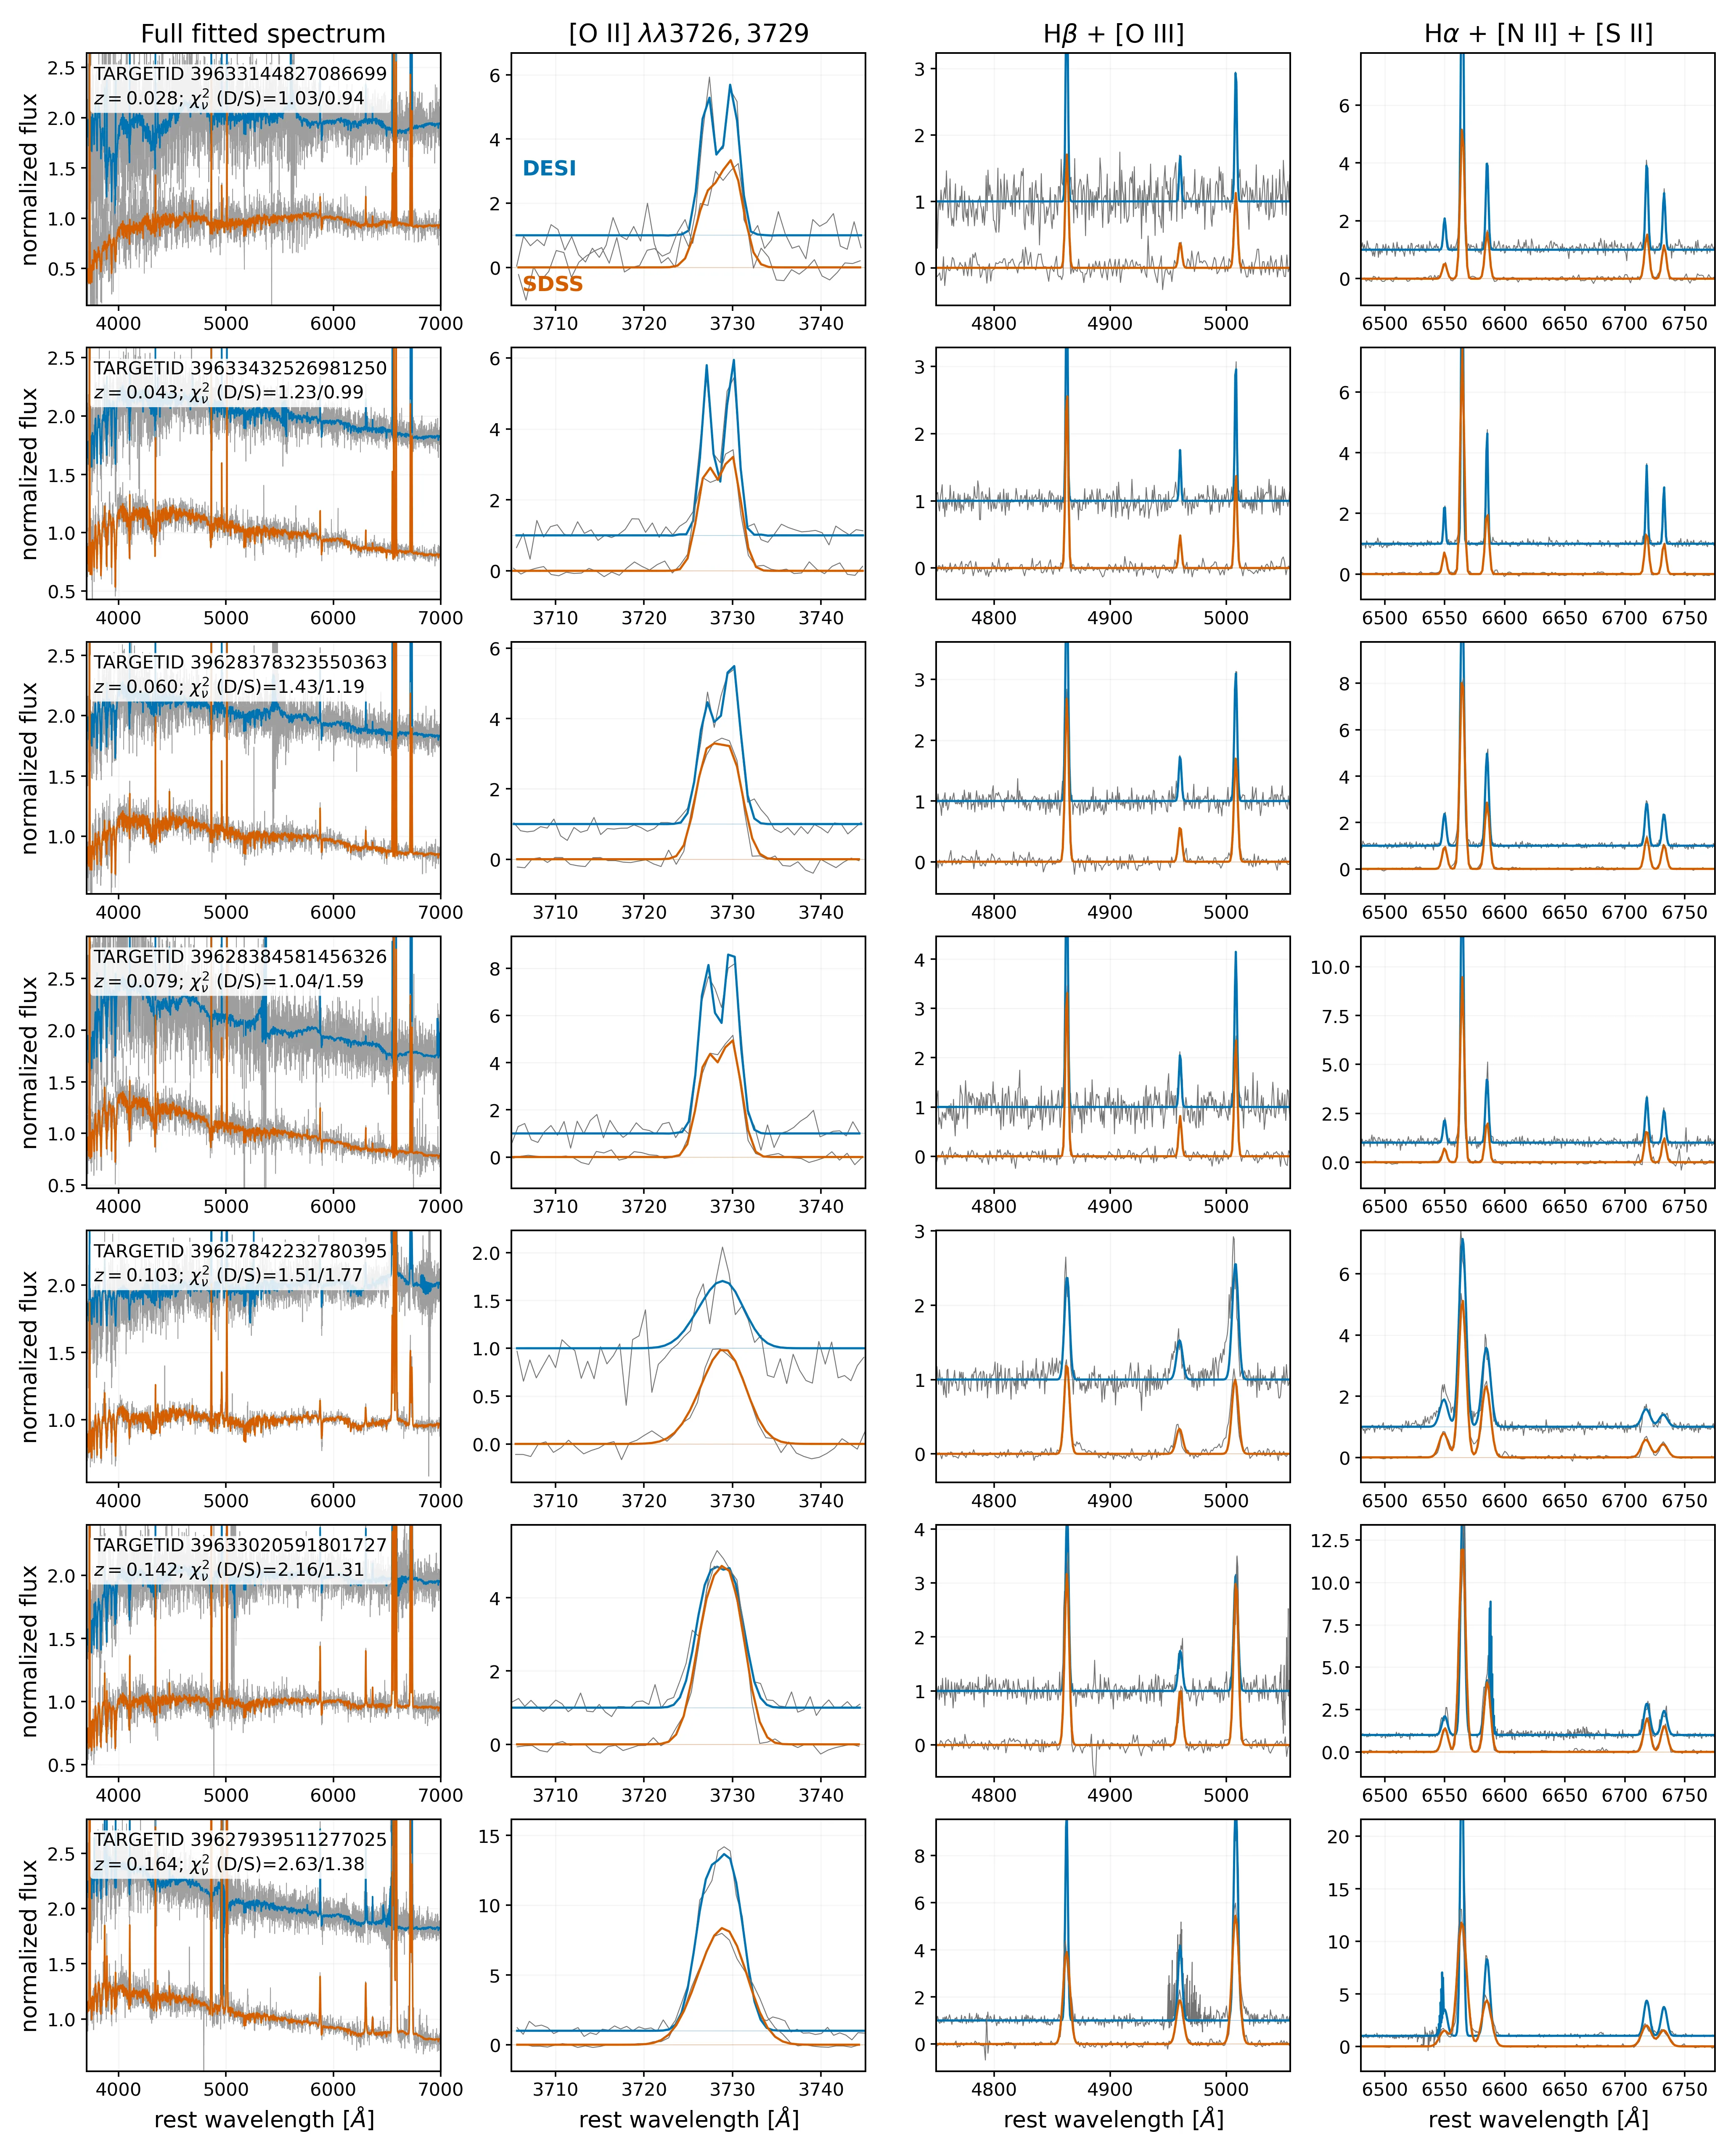
Two astronomical surveys look at the same galaxy through different windows. DESI's window is narrow, just 1.5 arcseconds across, and it catches only the bright core. SDSS's window is twice as wide, 3 arcseconds, and it also includes the outer spiral arms. If a galaxy is like a house with a fireplace glowing at the center and dust lying in the corners, the narrow window shows warm light, while the wide window adds gray shadows. The spectrographs behind these windows collect the light and spread it into a rainbow, where each line tells what the gas is made of.
The authors of the new study took 20,545 galaxies that appear in both catalogs and checked whether their chemical portraits match. To keep the windows from confusing the picture, they reprocessed all spectra with the same pipeline: subtracted starlight, fitted the bright gas lines, and kept only pairs of good quality. The final sample of 20,200 objects was large enough to detect even subtle discrepancies. They found that the narrow window systematically shifts several diagnostics: O3N2, which estimates the oxygen and nitrogen abundance, shifts by −0.0327 dex, and the Balmer decrement, sensitive to dust, by −0.0195 dex. For comparison, 0.03 dex corresponds to a change in flux of about 7 percent.
The shift is not constant: the farther the galaxy, the stronger the effect. At redshift 0.030, the median O3 shifts by −0.0106 dex, while at 0.111 it shifts by −0.0268 dex. The reason is that a distant galaxy appears smaller, so the narrow fiber becomes relatively wider and captures more of the outer regions. But even after accounting for distance, there remains a dependence on how the fiber is positioned on the galaxy. When the sample is divided by relative coverage, the difference between the top and bottom terciles for O3N2 reaches +0.0063 dex in the full sample and +0.0117 dex among pure star-forming galaxies. That is, two windows aimed at the same house show not just a different view but also weigh the rooms differently.
Previously, astronomers knew that a fixed aperture could distort emission-line diagnostics, but no one had directly measured the magnitude of the shift for the DESI and SDSS pair. Now this has been done on a large sample with a uniform pipeline, and the result can be used as a correction. If these hundredths of a dex are ignored, combined analyses of the two surveys will show spurious differences in metallicity or ionization, as if describing the same house from photographs taken through different windows, forgetting that the windows are of different widths. The next step is to check whether the shifts persist with other methods of starlight subtraction and to extend the calibration to galaxies with active nuclei.
Two windows into the same house are now calibrated relative to each other. Astronomers combining DESI and SDSS data can translate measurements from one window to the other, knowing how much the narrow window shifts the chemical portrait. This does not eliminate the difference, but it makes it predictable, so the house can be studied as a whole without fear that the window will deceive.
DESI's fiber has a diameter of 1.5 arcseconds, which on the sky corresponds to the size of a one-cent coin seen from about 2.5 kilometers away. Meanwhile, a galaxy at redshift 0.06 spans a much larger area on the sky, so the fiber captures only its central part.