Two Fibers, One Galaxy: How Aperture Distorts Optical Diagnostics ✛
Context
This work sits at the intersection of two major spectroscopic surveys. On one hand, DESI with its 1.5 arcsecond fiber opens a new era of massive galaxy spectra. On the other, a vast array of calibrations and comparison samples is inherited from SDSS with its 3 arcsecond fiber. In the archive, surrounding studies address various aspects of emission lines and aperture effects, from gas inflows and outflows to tests of cosmic homogeneity and searches for hidden baryons. But a direct comparison of DESI and SDSS for the same galaxies with all systematics controlled has been missing. This paper fills that gap, using the overlap of the two surveys as a natural experiment with two nested apertures.
Methods
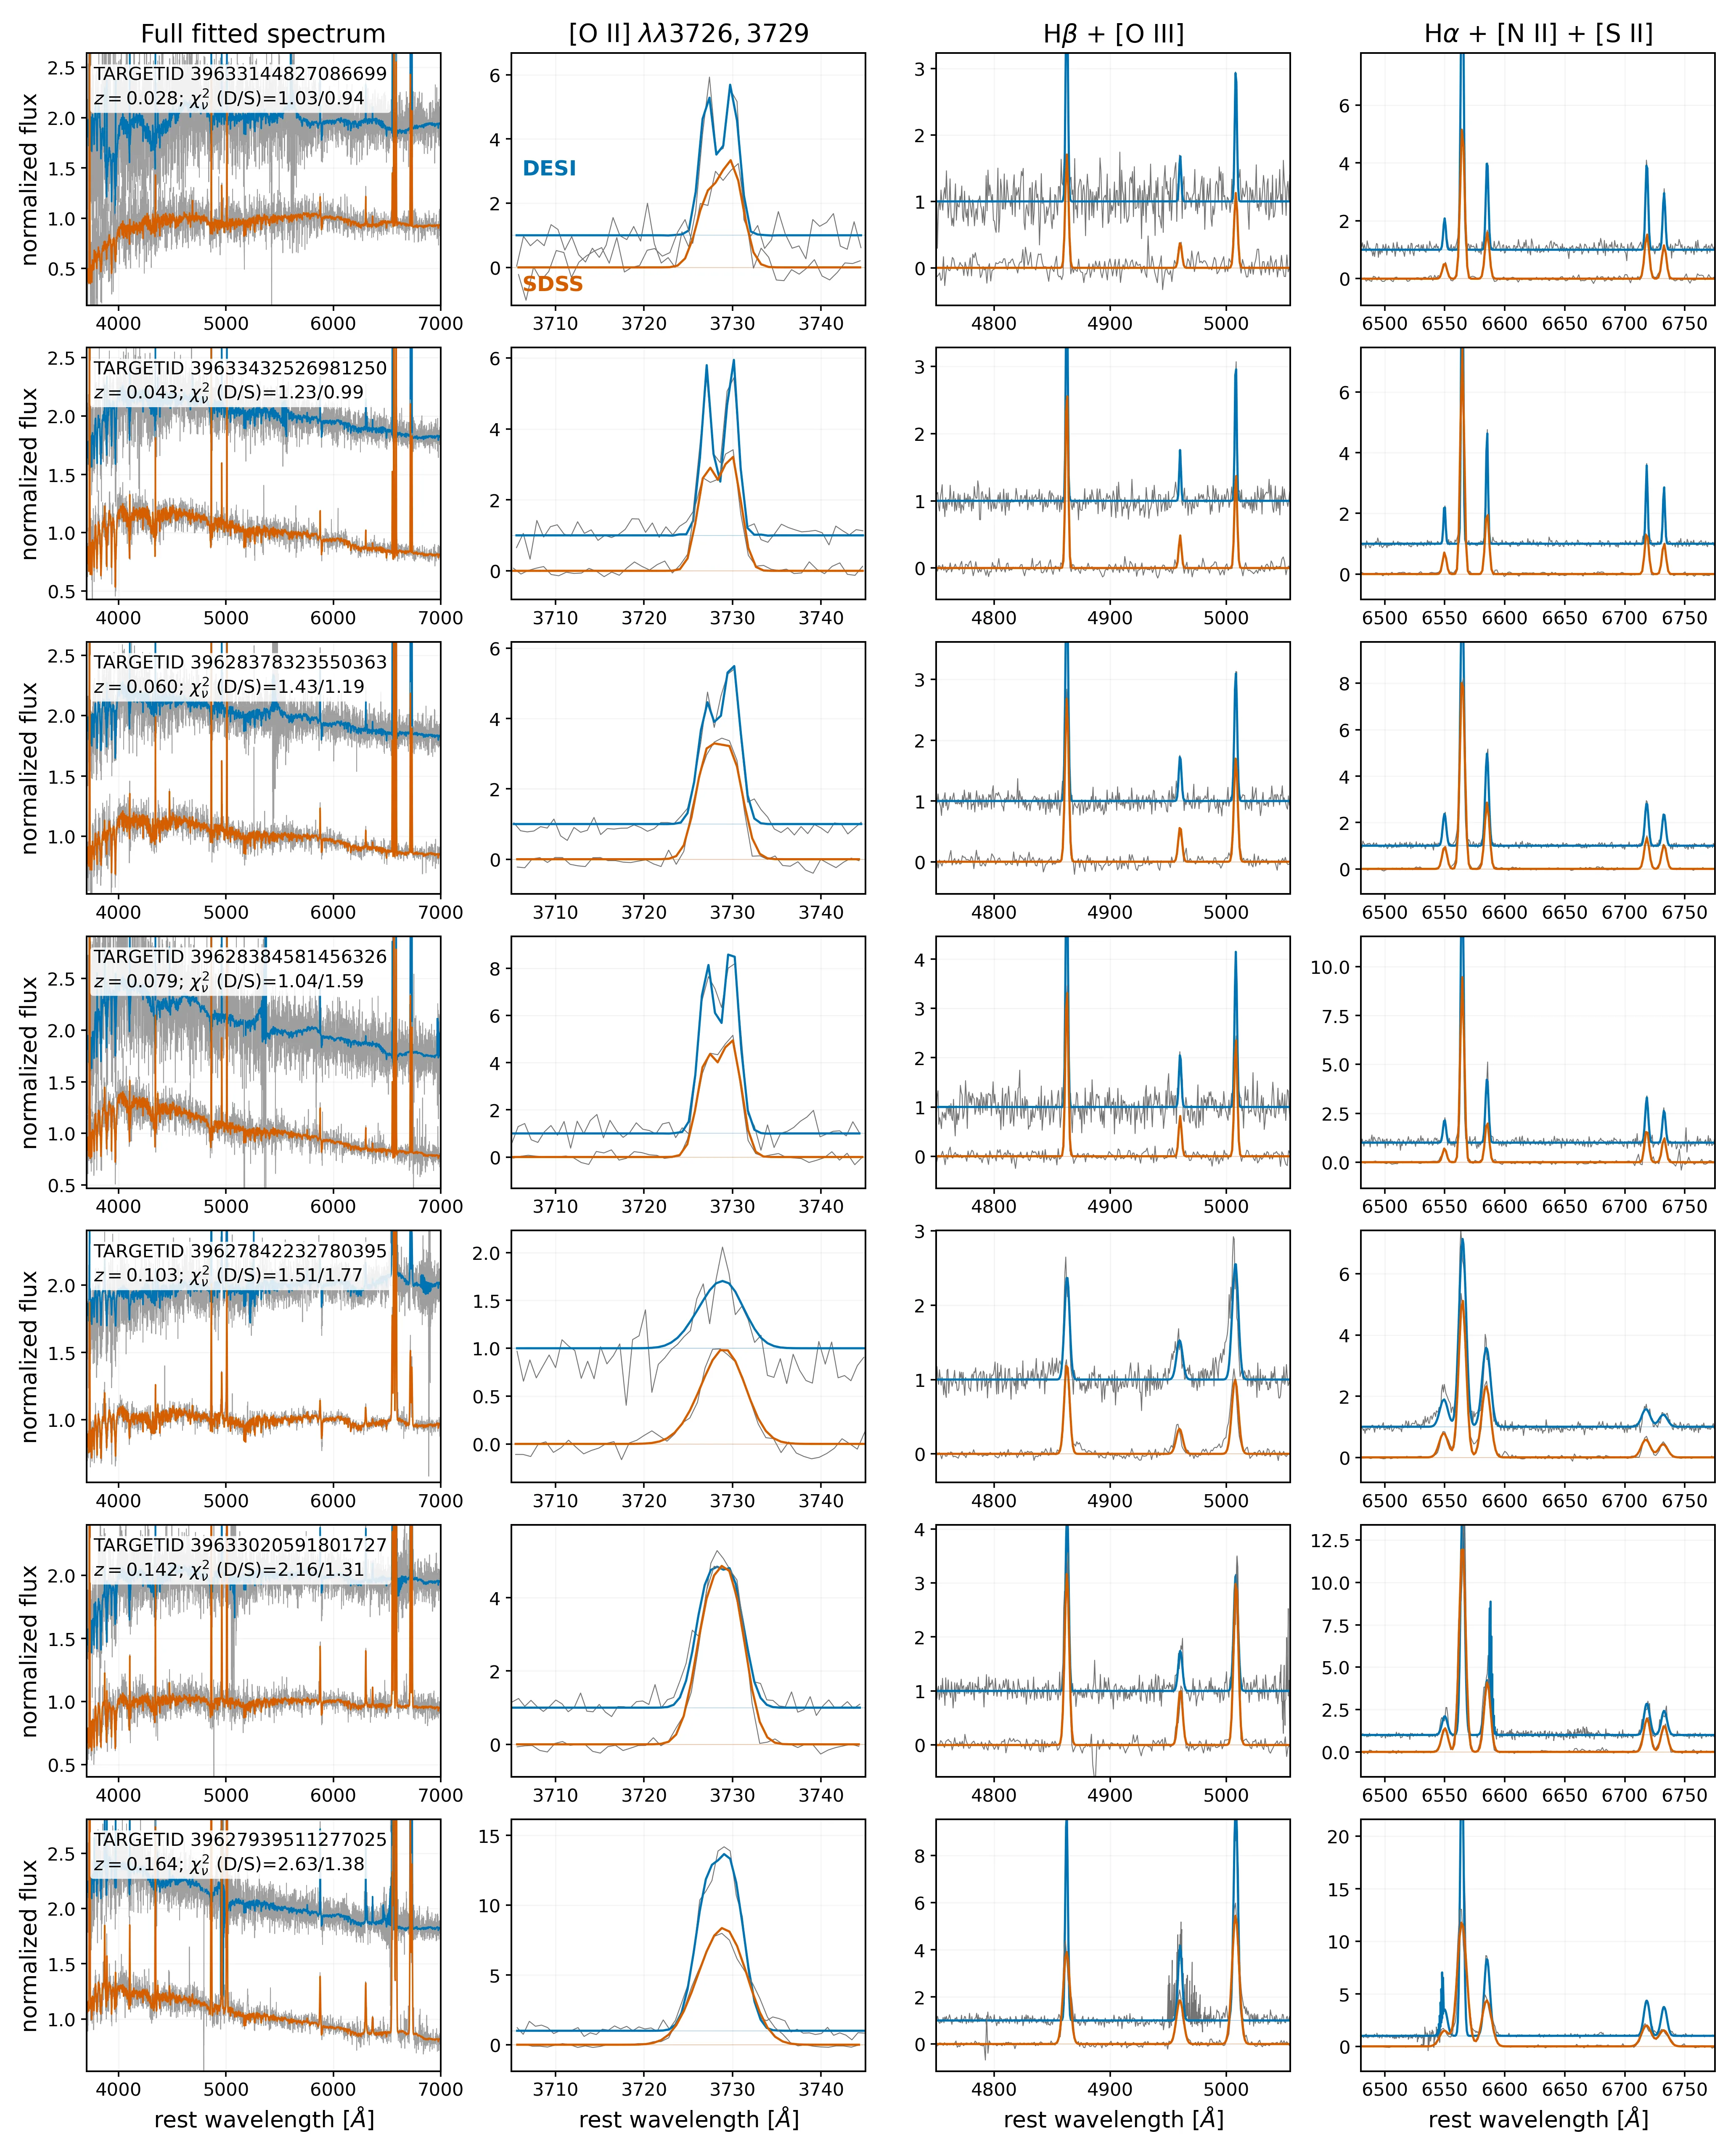
The authors selected 20,545 galaxies with spectra in both DESI DR1 and SDSS DR7, requiring fiber centers separated by less than 0.75 arcseconds and line-of-sight velocities agreeing within 100 km/s. To eliminate pipeline differences, all spectra were reprocessed with a unified method: the stellar continuum was modeled with 45 eMILES templates plus a Legendre polynomial, and after continuum subtraction all emission lines were fitted simultaneously, accounting for each instrument's spectral resolution. For quality control, only pairs with chi-squared less than 3 in both surveys were kept, yielding a final sample of 20,200 galaxies. Additionally, a subsample of pure star-forming galaxies was selected via the BPT diagram (15,564 objects), and a subsample with nearly concentric fibers (4,607 objects).
Results
Median shifts (DESI minus SDSS) for the full sample were: Δlog(N2) = +0.0067±0.0002, Δlog(S2) = −0.0148±0.0003, Δlog(O3) = −0.0246±0.0006, ΔO3N2 = −0.0327±0.0007, Δlog(Hα/Hβ) = −0.0195±0.0003, and Δlog([SII]6716/6731) = −0.0044±0.0003. In the pure star-forming subsample, the pattern is qualitatively the same: N2 is weakly positive, while the other indices are negative. In the nearly concentric subsample, the N2 shift diminishes, whereas S2, O3, O3N2, and the Balmer decrement remain significantly negative. The distributions of individual shifts are broad and asymmetric: for O3, for example, the central 68% lie from −0.104 to +0.041 dex. The shifts are not constant with redshift: the median O3 changes from −0.0106 dex at z=0.030 to −0.0268 dex at z=0.111. After controlling for redshift, a dependence on relative fiber coverage remains: for O3N2, the difference between the top and bottom coverage terciles reaches +0.0063 dex in the full sample and +0.0117 dex in the pure star-forming sample.
Implications
This work differs from its archive neighbors by directly measuring aperture shifts between DESI and SDSS on a large sample with a unified processing pipeline for the first time. Neighboring studies either examined aperture effects in integral field spectroscopy on small samples or used only one survey. Here, the real nested fibers of two massive surveys are exploited, providing a clean estimate of systematics that cannot be obtained from a single instrument. This is not just another confirmation of the existence of aperture bias, but a quantitative calibration of its magnitude for specific diagnostics across the redshift range of DESI.
Future development
The topic could develop in several directions. First, the analysis could be extended to a wider set of emission lines and to galaxies with low signal-to-noise ratios to understand how aperture shifts depend on object type. Second, upcoming DESI data releases will allow larger samples and refine dependencies on redshift and morphology. Third, empirical corrections could be built to convert DESI measurements to the SDSS system and vice versa, which is critical for the combined use of data from both surveys.
Impact
The results will affect any study that combines DESI and SDSS spectroscopic data to investigate metallicity, ionization, star formation, and nuclear activity in galaxies. This is especially relevant for work requiring differential comparisons at the level of hundredths of a dex.
Next steps
The immediate next step is to check whether the found shifts persist when using other stellar population models and other continuum subtraction methods. It is also important to perform a similar analysis for active galactic nuclei and for objects with faint emission lines.
Key open problems
The paper directly addresses the long-standing problem of aperture effects in galaxy spectroscopy, which limits the accuracy of strong-line calibrations and comparisons between surveys. It also touches on how radial gradients of physical properties in galaxies affect integrated measurements, an unresolved issue in observational cosmology.
The knowledge machine's view
This section is addressed to the author of the paper and their colleagues. Neighbouring works were found by meaning-based search across our archive, not by word overlap. We do not review: we show the field around the work.
What the work does
The authors compared the spectra of 20,545 galaxies observed by both DESI (1.5 arcsecond fibers) and SDSS (3 arcsecond fibers), reprocessing them through a single pipeline to isolate the aperture effect. They found small but significant shifts in emission-line diagnostics (for example, O3N2 at −0.0327 dex) that depend on redshift and on the relative fiber coverage.
Where its strength is
The work uses the overlap of the two surveys as a natural experiment with two nested apertures, allowing a direct quantitative assessment of aperture shifts across a broad set of diagnostics and providing, for the first time, a systematic picture for combining DESI and SDSS samples.
Where it could go next
- It might be interesting to see how aperture shifts relate to variations in physical conditions within galaxies, as analyzed in the work on density inhomogeneity in nebulae.based on: Nebula Orchestra: Why Lines Hear Different Densities arXiv:2607.07973
- A nearby study shows how dense gas can mimic low metallicity in integrated spectra; it may be worth checking to what extent aperture effects amplify or weaken such systematics.based on: Optical Illusion: How Dense Gas Masquerades as Metal-Poor Galaxies arXiv:2608.20339v1
- Given that the shifts depend on redshift, it would be useful to compare them with predictions from cosmological models that use galaxy twins, as in the work on dark energy.based on: Mirror Labyrinth of Dark Energy: How Galactic Twins Refract Cosmology arXiv:2607.01005v1
Worth trying
- Test the correction of aperture shifts using the relations between emission lines and local gas density from the work on inhomogeneous nebulae.
- Check whether systematics in metallicity estimates decrease after accounting for the dense-gas effect described in the work on the optical illusion.
- Use galaxy pairs with different apertures to calibrate corrections similar to those applied in cosmological analyses with twins.
Why this may matter
Understanding aperture shifts is critical for correctly combining DESI and SDSS data, which will enable the construction of homogeneous catalogs of galaxy emission properties and improve the accuracy of cosmological and evolutionary studies.
Nearby works in our archive
- Cosmic filaments pull in two directionssimilarity 0.54
- Nebula Orchestra: Why Lines Hear Different Densitiessimilarity 0.54
- Optical Illusion: How Dense Gas Masquerades as Metal-Poor Galaxiessimilarity 0.53
- The Universe's Hidden Currentssimilarity 0.52
- The Universe Is Not Standing Stillsimilarity 0.51
- Why the Same Material Glows Differentlysimilarity 0.51
- Mirror Labyrinth of Dark Energy: How Galactic Twins Refract Cosmologysimilarity 0.50
The archive is sparse around this work: the closest review is only 0.54, against a usual 0.64. It looks like few have drilled nearby.
The DESI fiber has a diameter of 1.5 arcseconds, which on the sky corresponds to the size of a one-cent coin seen from about 2.5 kilometers away. Yet a galaxy at redshift 0.06 subtends a much larger area, so the fiber captures only its central part.
Key numbers
- Number of matched galaxies: 20,545
- Number of galaxies after quality control: 20,200
- O3N2 shift: −0.0327 dex
- Balmer decrement shift: −0.0195 dex
- DESI fiber diameter: 1.5 arcseconds
- SDSS fiber diameter: 3 arcseconds