46 ways to calculate risk express
Geneticists read DNA like a long list of letters. From it, they compute a "polygenic risk score" — a number that shows how much higher or lower a person's chance of getting a disease, like diabetes, is compared to average. There are dozens of such risk calculation methods now, and each does it differently: one looks at a thousand letters, another at a million, a third requires a powerful computer, and a fourth crashes halfway through the data.
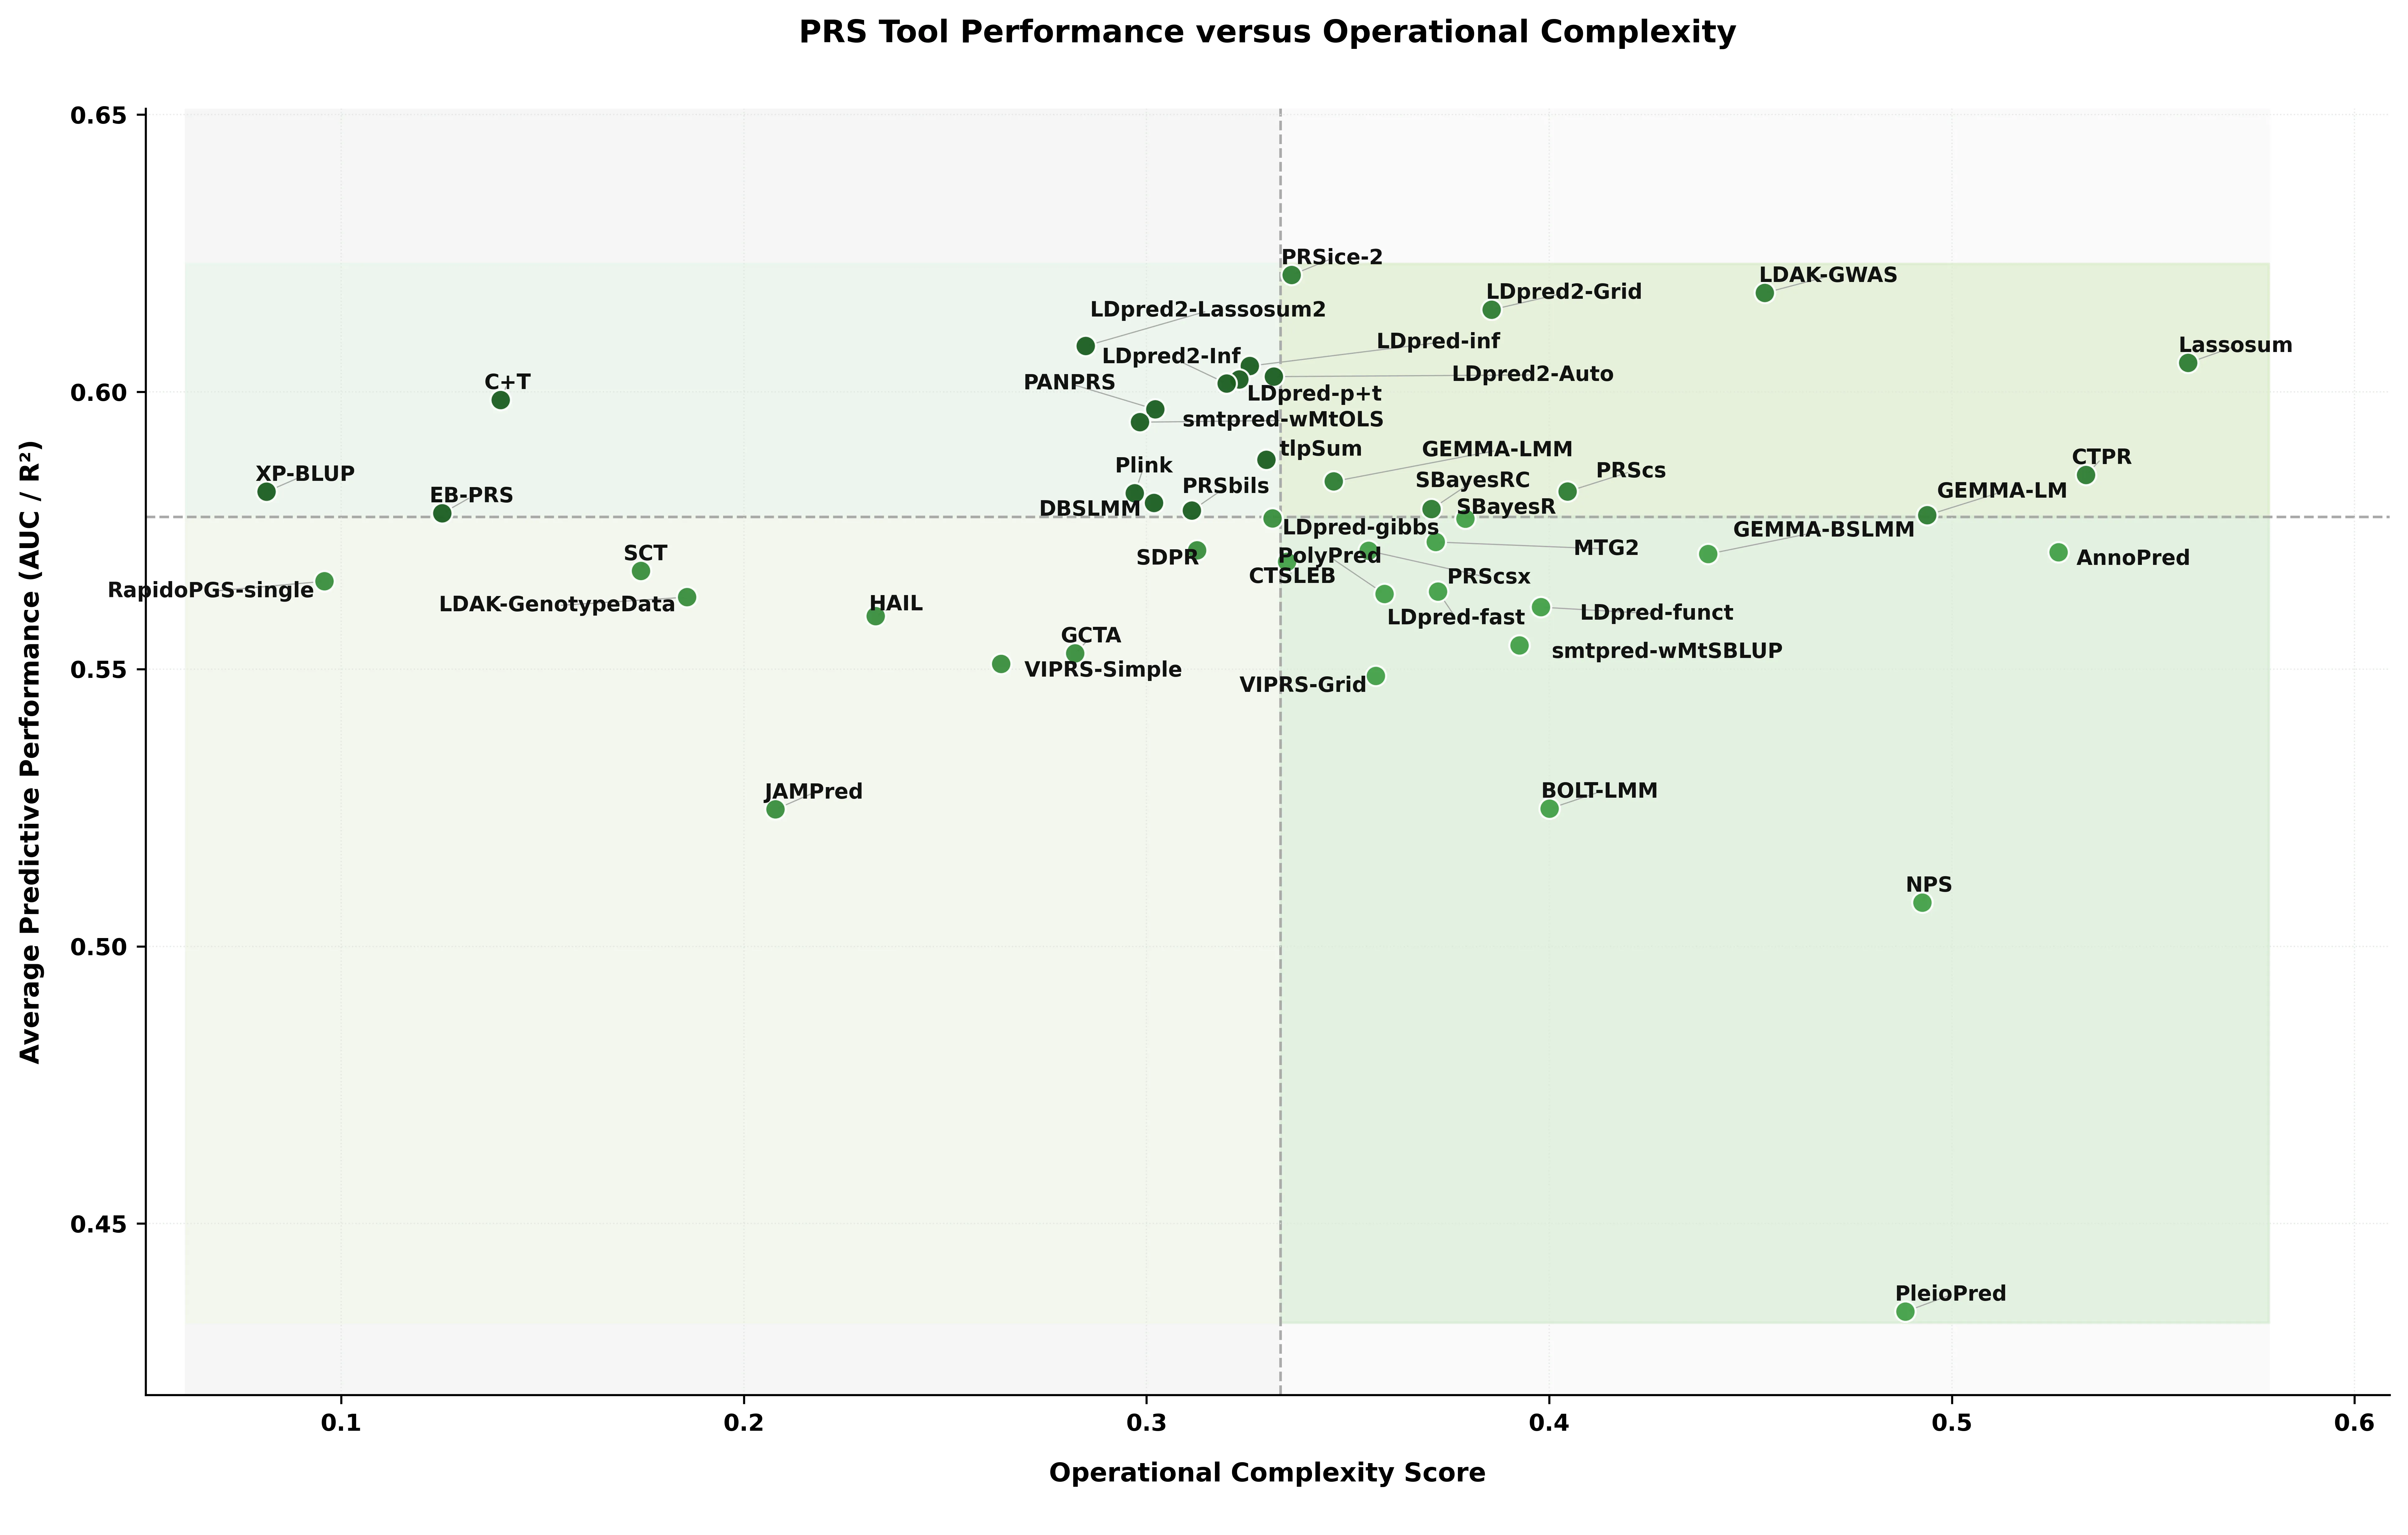
The authors gathered 46 such tools and gave them a fair exam. They took data from the UK Biobank, which stores DNA samples and medical records of hundreds of thousands of people. Each tool had to predict seven diseases and one common trait (like height). They tested in three scenarios: with no additional data, with only DNA, and with age, sex, and other information included. It turned out there is no universal winner: one tool is good for diabetes, another for asthma, and a third is the fastest but slightly less accurate.
The practical takeaway is simple: choosing a tool is not just about math. You need to consider how much data you have, how powerful your computer is, and whether the program can avoid crashing mid-calculation. The authors made their framework open so that any researcher can repeat the comparison on their own data and avoid the same pitfalls.
Original abstract
as written by the authors arXiv:2603.21201
Polygenic risk score (PRS) tools differ substantially in statistical assumptions, input requirements, and implementation complexity, making direct comparison difficult. We developed a harmonized, implementation-aware benchmarking framework to evaluate 46 PRS tools across seven binary UK Biobank phenotypes and one continuous trait under three model configurations: null, PRS-only, and PRS plus covariates. The framework integrates standardized preprocessing, tool-specific execution, hyperparameter exploration, and unified downstream evaluation using five-fold cross-validation on high-performance computing infrastructure. In addition to predictive performance, we assessed runtime, memory use, input dependencies, and failure modes. A Friedman test across 40 phenotype--fold combinations confirmed significant differences in tool rankings ($$\chi^2 = 102.29$$, $$p = 2.57 \times 10^{-11}$$), with no single method universally optimal. These findings provide a reproducible framework for comparative PRS evaluation and demonstrate that tool performance is shaped not only by statistical methodology but also by phenotype architecture, preprocessing choices, covariate structure, computational demands, software robustness, and practical implementation constraints.
One of the tools in the test could use 100 times more memory than another, while achieving nearly the same prediction accuracy.