Eye Movements Reveal Autism in One in Three express
Eyes follow a dot that smoothly traces a complex curve on the screen. For most people, the gaze stays close to it, but for some, it seems to slip or lag behind. Previously, such peculiarities drowned in average numbers: if you add everyone up and divide, the difference almost disappears.
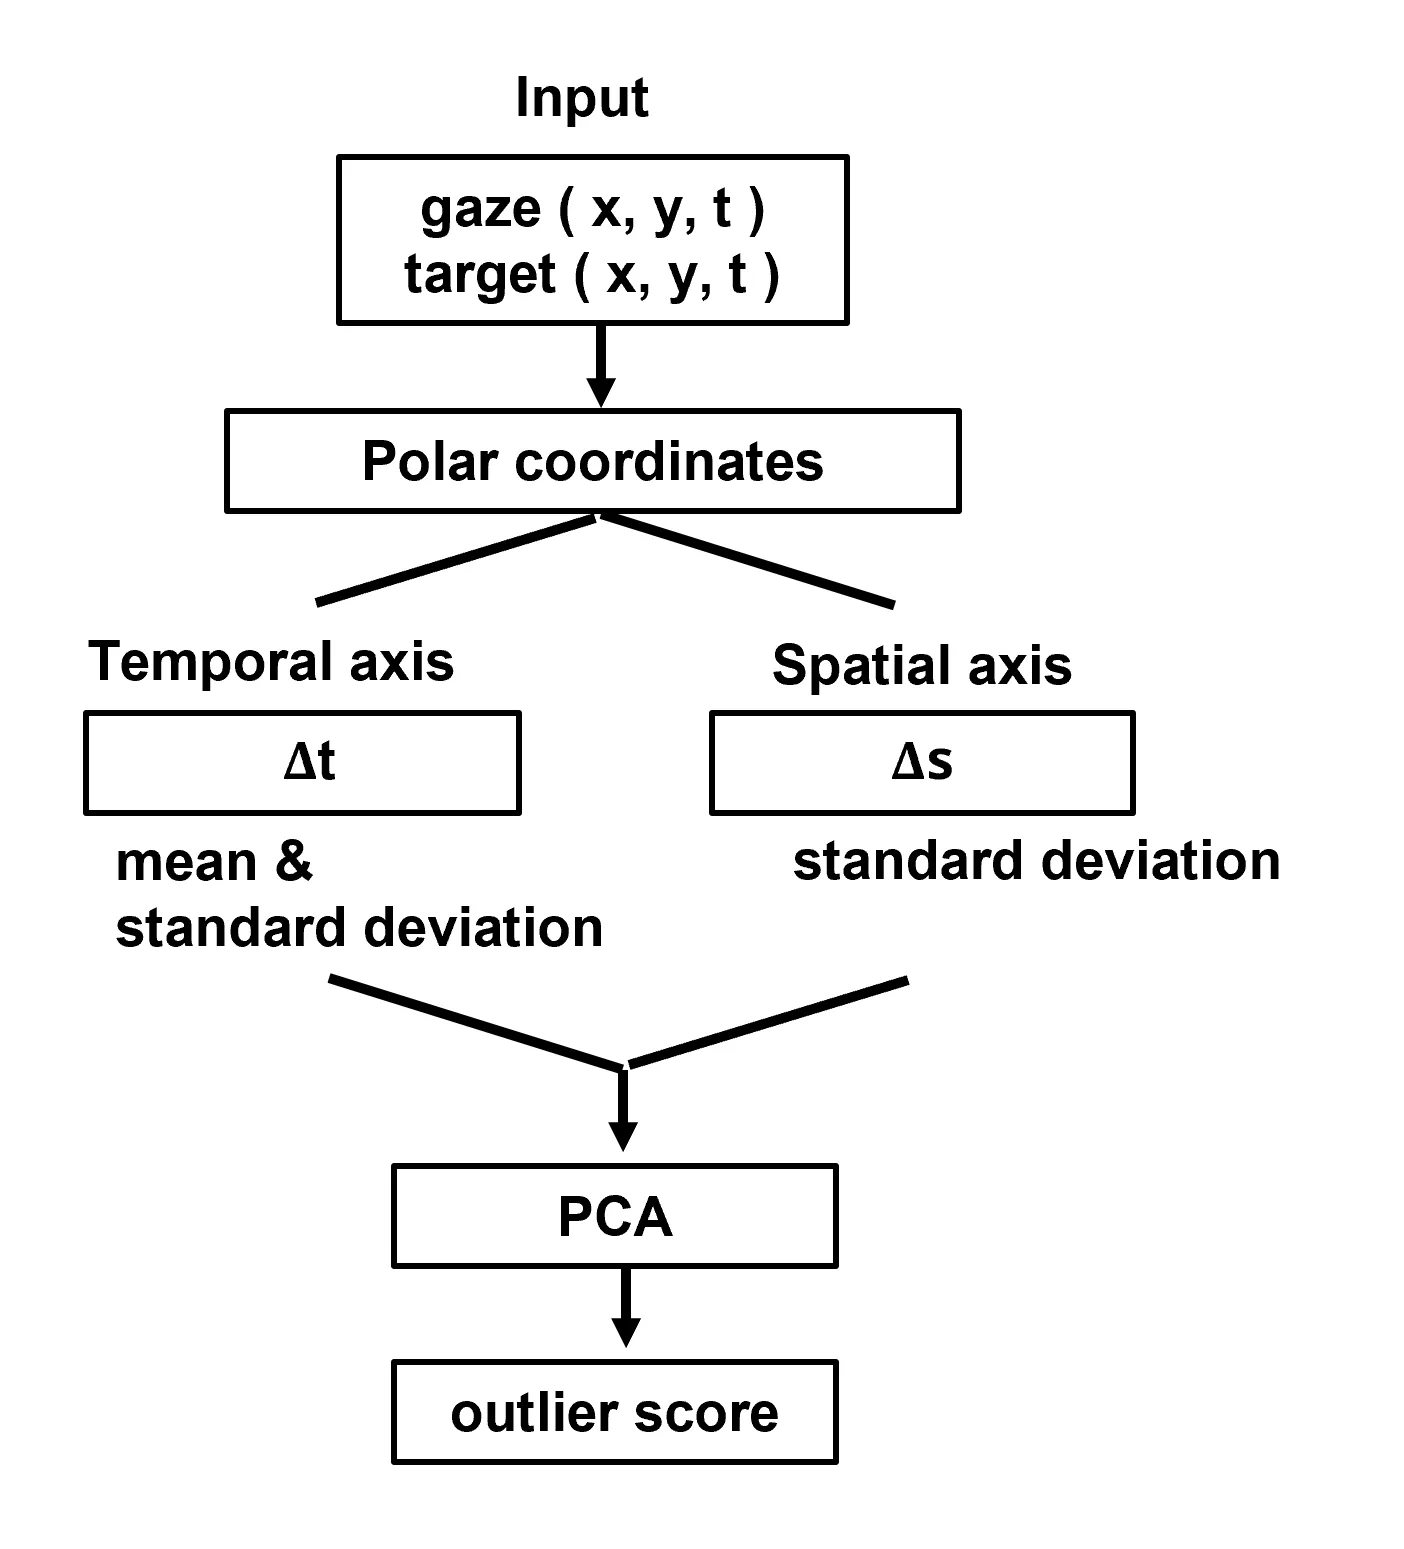
Instead of looking at averages, the scientists decided to examine each person individually. They measured how far the gaze lagged behind the dot and how much it deviated to the side. Then they built a "norm" from people without autism and counted who deviated from it more than usual. This approach is like checking height in schoolchildren: instead of comparing the class average height, a doctor notes children who are much shorter or taller than their peers.
The result was surprising: among people with autism, 7 out of 18—almost 39%—moved their eyes unusually. In the group without autism, only 5% did. Meanwhile, standard average comparisons showed almost no difference. This means autism manifests differently in each person, and these individual deviations may be the key to understanding it.
This method could help doctors detect autism earlier and more accurately. And importantly, it respects diversity: it doesn't try to fit everyone into one mold but sees each person individually.
Original abstract
as written by the authors arXiv:2603.22705
Background: Autism spectrum disorder (ASD) is characterized by significant clinical and biological heterogeneity. Conventional group-mean analyses of eye movements often mask individual atypicalities, potentially overlooking critical pathological signatures. This study aimed to identify idiosyncratic oculomotor patterns in ASD using an "outlier analysis" of smooth pursuit eye movement (SPEM). Methods: We recorded SPEM during a slow Lissajous pursuit task in 18 adults with ASD and 39 typically developed (TD) individuals. To quantify individual deviations, we derived an "outlier score" based on the Mahalanobis distance. This score was calculated from a feature vector, optimized via Principal Component Analysis (PCA), comprising the temporal lag ($$\Delta$$t) and the spatial deviation ($$\Delta$$s). An outlier was statistically defined as a score exceeding $$\sqrt{10}$$ (approximately 3.16$$\sigma$$) relative to the TD normative distribution. Results: While the TD group exhibited a low outlier rate of 5.1%, the ASD group demonstrated a significantly higher prevalence of 38.9% (7/18) (binomial P = 0.0034). Furthermore, the mean outlier score was significantly elevated in the ASD group (3.00 $$\pm$$ 2.62) compared to the TD group (1.52 $$\pm$$ 0.80; P = 0.002). Notably, these extreme deviations were captured even when conventional mean-based comparisons showed limited sensitivity. Conclusions: Our outlier analysis successfully visualized the high degree of idiosyncratic atypicality in ASD oculomotor control. By shifting the focus from group averages to individual deviations, this approach provides a sensitive metric for capturing the inherent heterogeneity of ASD, offering a potential baseline for identifying clinical subtypes.
People with autism exhibit unusual eye movements almost eight times more often than others.