Standard deviation is a statistical measure that quantifies the amount of variation or dispersion in a set of values. It tells you how spread out the numbers are around the mean (average). A small standard deviation means the values are clustered closely, while a large one indicates wide spread. In physics, it is used to characterize the uncertainty in measurements, the spread of particle velocities in a gas, or the noise in experimental data.
History
The concept was introduced by Karl Pearson in 1894, building on earlier work by Gauss and others on the normal distribution and least squares methods.
How it works
To compute it, you take the square root of the variance, which is the average of the squared differences from the mean. This gives a value in the same units as the original data, making it intuitive. In a normal distribution, about 68% of values lie within one standard deviation of the mean, 95% within two, and 99.7% within three—a rule of thumb used widely in quality control and error analysis.
The standard deviation of the cosmic microwave background temperature fluctuations is about 18 microkelvins, a tiny number that encodes the seeds of all structure in the universe.
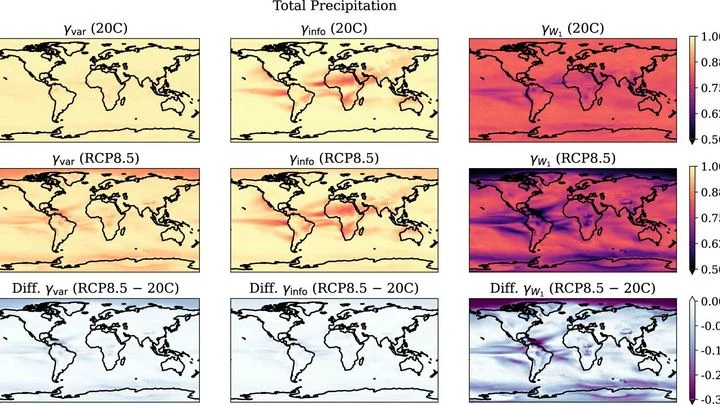
In winter, one part of town gets three times as much snow as the neighborhood next door. One year is a scorcher, the next is a cold snap. That's the whims of weather. But over decades, a different, slow shift emerges: winters, on average, get milder. Telling the two apart is the central challenge for climate scientists.
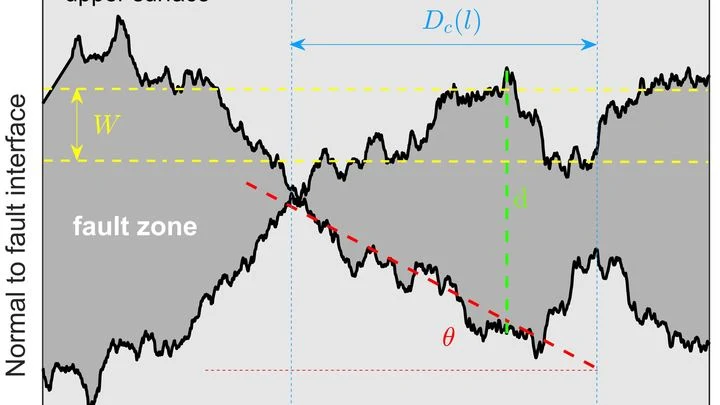
Two pieces of sandpaper are pressed tightly together. As you start to slide them, they first catch on the rough spots, then suddenly slip. A fault in the Earth behaves much the same way during an earthquake. But there's a crucial detail: how far do you need to push the edges before the grip gives way? This distance is called the critical slip distance.
Water droplets shoot out of a nozzle one after another, like cyclists on a narrow track. The faster ones catch up with the slower ones and merge into larger drops. This simple mechanism is called ballistic aggregation, and until now it had only been observed on cosmic scales: this is how dust particles stick together to form planets.
Imagine a ball in an unfamiliar hall: two guests start from opposite corners. Their movements are not a smooth waltz but chaotic improvisation in search of rare treasures. Contrary to intuition, the outcome hinges not on tempo but on the geometry of the floor.
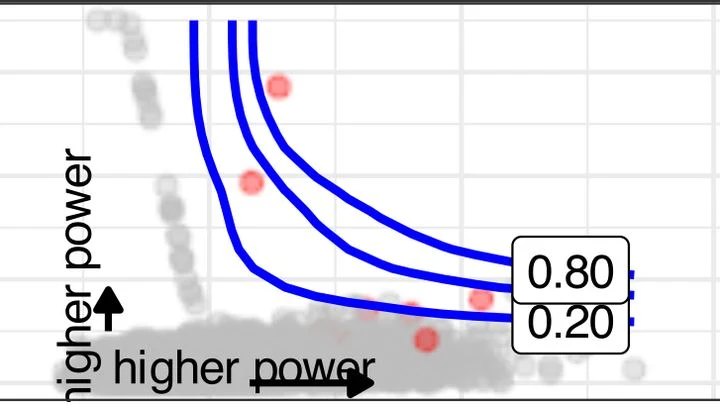
When you're planning a renovation, you don't buy paint by eye: you measure the wall area. In science, deciding how many samples to collect is a similar guess, but the stakes are higher. Skimp on samples, and your study becomes a lottery: you might miss a real effect, or you might mistake noise for a discovery. Overshoot, and you're wasting tubes, months, and, in animal experiments, lives.
Spread a handful of coins on the table. Each coin is a possible outcome: heads, tails, or something else. If we know how chaotic this set is (its entropy), which combinations of probabilities will we encounter more often? It turns out the answer depends on how much chaos we allow.
Eyes follow a dot that smoothly traces a complex curve on the screen. For most people, the gaze stays close to it, but for some, it seems to slip or lag behind. Previously, such peculiarities drowned in average numbers: if you add everyone up and divide, the difference almost disappears.
Instead of looking at averages, the scientists decided to examine each person individually.
In a particle accelerator, nuclei shatter into fragments like a porcelain cup dropped on the floor. Each fragment flies through silicon wafers, which register the impact and its strength. But to distinguish a real signal from random noise, you need a threshold: below it, readings are considered interference.
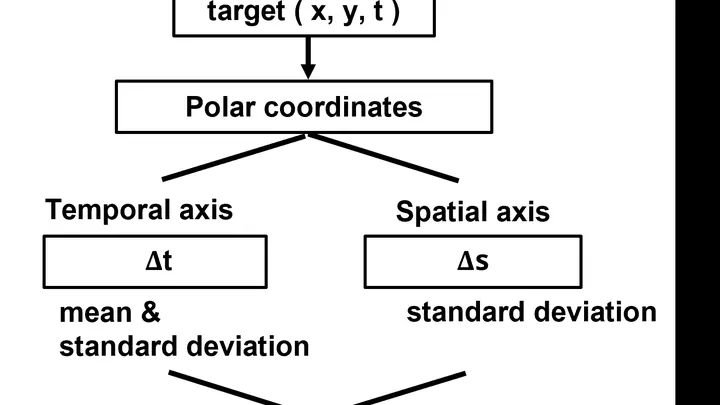
In the dark clouds of interstellar gas where stars are born, matter gathers into dense knots — future cradles of stars. Astronomers measure distances between these knots from sky photographs, but a photograph is flat while the cloud is volumetric. Converting from plane to volume is not as simple as it seems.
Galaxies in the Universe are not scattered randomly: neighboring ones move in the same direction, like a school of fish, while distant ones each go their own way. Where the boundary between 'together' and 'apart' lies has been unclear until now.