The Anderson–Darling test is a statistical test used to decide whether a sample of data comes from a specific probability distribution. It is a refinement of the older Kolmogorov–Smirnov test, designed to be more sensitive to differences in the tails of the distribution — exactly where the Kolmogorov–Smirnov test tends to miss deviations. This makes it particularly useful in fields like quality control and finance, where extreme events or outliers matter more than the central tendency.
History
The test was introduced by Theodore W. Anderson and Donald A. Darling in 1952.
How it works
Like other goodness-of-fit tests, it compares the empirical cumulative distribution function of the sample with the theoretical cumulative distribution function of the hypothesized distribution. The test statistic is a weighted squared difference between the two, with weights that are larger at the tails. The resulting value is compared against critical values (which depend on the hypothesized distribution) to decide whether the sample is consistent with that distribution.
In practice
It is widely used in statistical process control to check whether a production process output follows a normal distribution, and in risk management to validate models of extreme events.
Fun fact
The Anderson–Darling test is so sensitive to the tails that it can detect a slight heavy-tailedness in a sample that looks perfectly normal on a histogram.
Two figure skaters on a lake frozen to the horizon. They are so far apart that their silhouettes turn into dots, and their mutual attraction becomes almost an article of faith. By Newton's law, they should circle in an unimaginably slow waltz. But telescopes see otherwise.
Spread a handful of coins on the table. Each coin is a possible outcome: heads, tails, or something else. If we know how chaotic this set is (its entropy), which combinations of probabilities will we encounter more often? It turns out the answer depends on how much chaos we allow.
When matter is compressed to pressures of millions of atmospheres and heated to thousands of degrees, it is neither solid nor gas. This warm dense state is like the interiors of giant planets or the moment of a meteorite impact. You can't look inside directly, but you can shine X-rays and see how they scatter off electrons.
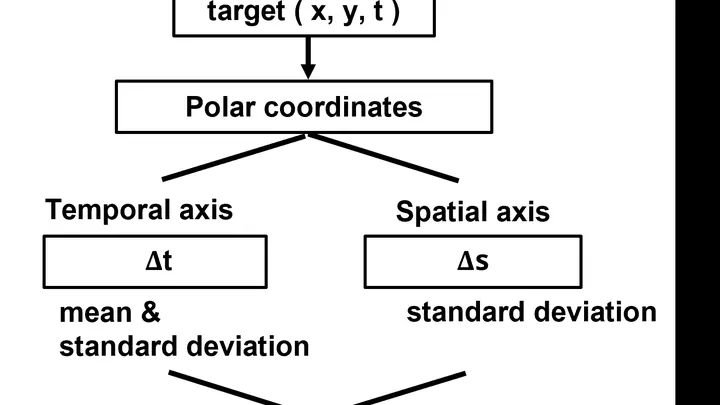
Eyes follow a dot that smoothly traces a complex curve on the screen. For most people, the gaze stays close to it, but for some, it seems to slip or lag behind. Previously, such peculiarities drowned in average numbers: if you add everyone up and divide, the difference almost disappears.
Instead of looking at averages, the scientists decided to examine each person individually.
The ocean doesn't always stick to the same schedule. Sometimes the warm El Niño current strengthens, sometimes it weakens, and each regime dictates its own reaction speed to the past. These hidden regimes are like shifts in currents that remember their path with different depths.