Spectroscopy is like a rainbow that tells the secrets of distant stars. When sunlight passes through a prism, it splits into colors. Scientists look at these colored bands and find out what stars and planets are made of, as if reading their 'fingerprints'. It's similar to how you can tell what animal passed by from tracks in the sand.
History
The origins of spectroscopy go back to Newton's experiments with a prism (1666). In 1802, William Wollaston observed dark lines in the solar spectrum, but it was Joseph Fraunhofer who described them in detail in 1814. Kirchhoff and Bunsen in 1859 established the link between spectral lines and chemical elements, creating the method of spectral analysis. In 1885, Johann Balmer empirically described a series of hydrogen lines in the visible region. Later, Niels Bohr provided a quantum explanation of the hydrogen spectrum (1913), and the quantum mechanics of Schrödinger and others generalized the theory. Cecilia Payne-Gaposchkin in 1925, using spectroscopy, showed that stars are composed mainly of hydrogen and helium. Modern spectroscopy uses Fourier transform and multichannel detectors.
How it works
Atoms and molecules have discrete energy levels. When an electron transitions from a higher level to a lower one, a photon is emitted with energy equal to the difference: ΔE = hν. The frequency ν and wavelength λ determine the position of the spectral line. The set of lines forms a unique 'signature' of an element. In astrophysics, spectroscopy allows measuring radial velocities through the Doppler shift of lines (Doppler effect), and from line broadening — temperature and turbulence. Planck's law of radiation describes the continuous spectrum of heated bodies. Maxwell's equations explain the nature of light as an electromagnetic wave. Quantum mechanics (Schrödinger equation) predicts the exact transition frequencies.
Fun fact
Each chemical element leaves its own unique 'color code' in the spectrum — like a barcode in a store. For example, hydrogen always shows pink, blue, and violet lines. Astronomers use this to find water on distant planets!
Surf doesn't roll onto the shore as an even front. It comes in tongues of foam that merge and split apart. Magnetic fields inside materials behave much the same way: they breathe in waves, and until now nobody had seen them whole.
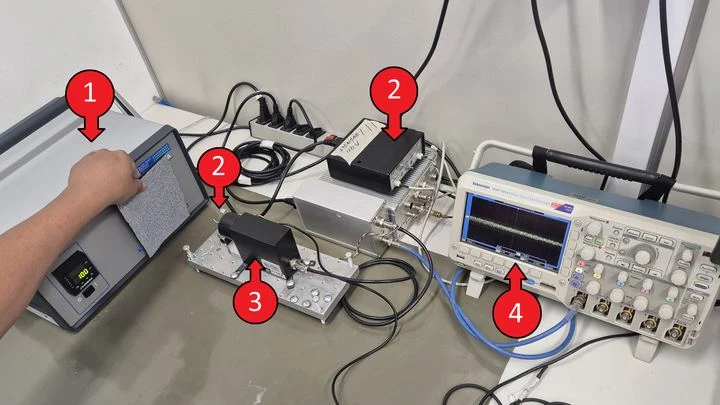
An aluminum sphere the size of a large globe sits in a neutron beam and answers each hit with a precise note. Inside the sphere there is nothing but nitrogen and eleven tiny steel balls, each the size of a pinhead. When a neutron enters the sphere, it knocks a particle out of a nitrogen atom, and that jolt turns into an electrical signal.
A theater spotlight keeps the actor in its beam no matter where they step. The terahertz radar we are about to describe does the same with a short light pulse reflected off a moving object.
Terahertz waves sit between microwaves and infrared light.
A storm in the upper atmosphere lasts a few millionths of a second. A cosmic ray, a proton or a helium nucleus, strikes air molecules, sending a swarm of particles downward. Most of them stay together, but occasionally one particle gains so much energy that it surges ahead.
A cartographer receives a sheet with distances between hundreds of unnamed islands. No island is labeled, but the distances repeat, forming triangles and quadrilaterals. From these repetitions, the cartographer reconstructs the map of the archipelago, not knowing which island is which. This is roughly how the new work in molecular spectroscopy works.
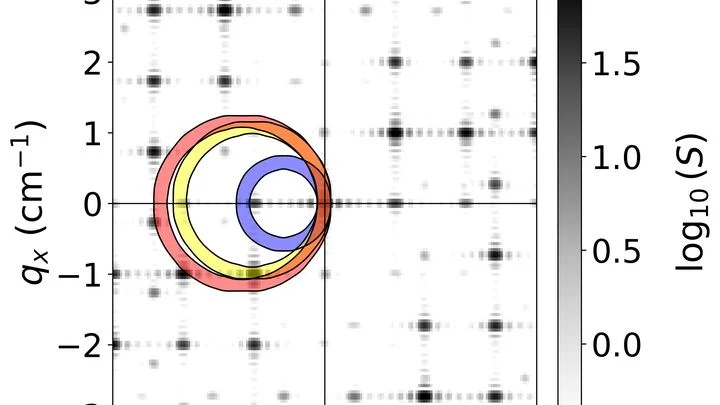
In the layered crystal CrSBr, the magnetic moments of atoms are arranged like notes in a score: within each layer they point in the same direction, but between layers they point in opposite directions. This antiferromagnetic melody plays up to 132 kelvin, beyond which thermal motion destroys the order.
Two strings are stretched side by side: one thick and dull, the other thin and bright. Pluck the thick one, and you get a muddy sound with no clear pitch. The thin one responds with a pure tone. But link them together, and an unexpected effect appears: a sharp dip in the spectrum, as if someone muted a single note.
At 359.8 K (about 87 °C), a substance made of bent, banana-shaped molecules transitions into a liquid crystal phase where the molecules assemble into layers. But unlike ordinary layers where all the 'bananas' lie the same way, here they are tilted in two directions at once, like cherry pits in a jar that can point both up and sideways.
Inside an atomic nucleus, protons and neutrons don't sit still like peas in a pod. Each particle occupies its own orbit — a region of space where it can be found. The larger the orbit, the more 'smeared out' the particle is.
A single DNA molecule, squeezed into a tiny metal slit, trembles and flickers under the laser. Its signal is not a clear string of letters but a chaotic mix of flashes and shadows. Deciphering this noise is like trying to make out a whisper in a crowded room.
The new neural network works like an attentive interpreter.
A single photon is like a perfectly smooth brick from which quantum technologies can be built. But to build a house, you need thousands of identical bricks. Rubidium atoms are natural emitters: each atom emits photons of exactly one wavelength, like a tuning fork that always produces a single note.
A superconducting quantum interferometer is a device that senses magnetic fields billions of times weaker than the needle of an ordinary compass. Inside it, there is a narrow bridge where superconductivity briefly breaks.
Two stars, AF Lep A and ε Indi A, have become the focus of close attention. Using the GHOST spectrograph on the Gemini telescope, astronomers split their light into colors and, from absorption lines, determined how much carbon, oxygen, sulfur, and thirteen other elements are in the stars' atmospheres.
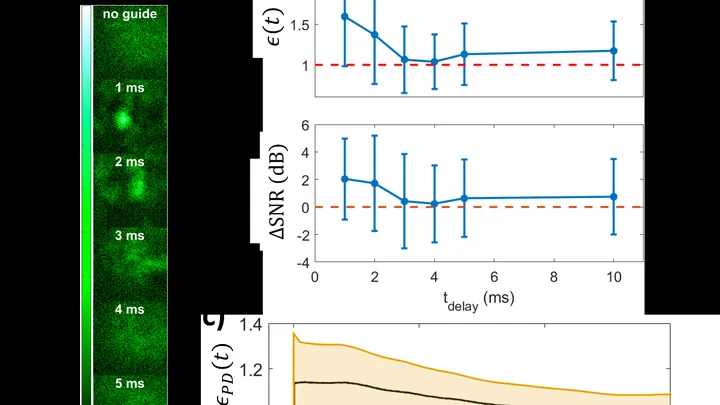
In a glass of murky liquid where starch is settling, the eye sees only a gray haze. Particles inside are moving, but what exactly is happening remains a mystery. Conventional optical instruments cannot penetrate such a suspension: light scatters already in the top layer.
On the surface of the Moon and asteroids, you can find pits smaller than a pinhead but with shiny, melted rims. Such marks are left by tiny meteorites, but the exact impact speed at which melting occurs remained unclear.
When a ψ(2S) particle decays into a proton and an antiproton, two different mechanisms act simultaneously: the strong interaction, like glue holding quarks together, and the electromagnetic one, like light pushing charges apart. Their contributions add up with a certain phase shift.
A shooter aims at a target, pulls the trigger, and hears two shots: one loud, one quiet. That's how the new setup works, except instead of bullets, there's an electron bunch, and instead of shots, there are two flashes of light. One flash is X-ray, the other is terahertz. They fly to the same point with perfect timing.
A laser beam passes through a glass cell filled with cesium vapor. The atoms in the vapor dart around chaotically, like a crowd at a train station: each one enters the beam, spends a moment there, and flies back out. Their internal state, something like the orientation of a tiny magnet, changes under the influence of light. If all atoms were identical and stationary, the signal would be steady.
The Sun's edge looks like a fuzzy fringe: thin jets of hot gas, spicules, shoot upward from it. They live only a few minutes and are constantly changing. In 2024, a balloon-borne telescope managed to spot not only the jets themselves but also their faint glow in hydrogen lines that had never been captured there before.
Light passing through a glass of murky water dims — some of it is absorbed. That's how many liquid-analysis instruments work: they measure how much light was lost and infer the composition from that. But if the liquid is heterogeneous, like soup with chunks, a single number isn't enough: you need to know where exactly more absorption happened.
In a crystal of rutile niobate, nickel atoms sit in oxygen cages — octahedra. Sometimes one atom loses an electron, and the charge hops to a neighboring atom like a baton in a relay race. But this hop is not random: it is triggered by vibrations of the entire lattice.
Waves on the water's surface usually break against any obstacle — a rock, a piling, an island. But what if you arrange obstacles so cleverly that the wave barely notices them? In a new study, scientists assembled a pattern of many points on the water, arranged according to special mathematical rules, and sent waves through them.
The helium atom is like a tightly stretched string: every note it plays is strictly predicted by theory. But in recent years, precise measurements of one such "note"—the energy needed to strip an electron from an excited helium atom — have started to sound slightly higher than they should.
A protein is like a tiny machine that switches on and off on command. The command arrives when another molecule sticks to it, like a key in a lock. The protein then changes shape and passes the signal along. But exactly how the signal travels inside the protein has long been a mystery.
A smartphone camera captures light with tiny sensors, but by themselves, they can't distinguish colors. So color filters are placed in front of them: red, green, blue, like stained glass in a window. Each sensor sees only its own color, and then software assembles the full picture from these pieces.
In an ordinary semiconductor, it is hard to get two things at once: strong magnetism and a tightly bound electron-hole pair that is born when light is absorbed. Magnetic impurities, which make a material magnetic, also prevent the electron and hole from staying together: they are like noisy neighbors that do not let the pair exist in peace.
A synchrotron beam is like a jet of water from a hose: wide and awkward for fine work. To examine a tiny sample, you need a fine needle, not a hose. In the new setup, the needle is a glass capillary — a tube through which light glides, reflecting off the walls like a voice echoing down a long corridor.
Microwave plasma in a vortex is like a kitchen mixer that simultaneously heats and stirs the gas. In the reactor, the gas is swirled, and microwaves heat it to thousands of degrees, tearing carbon dioxide molecules apart. Scientists created a computer model of such a reactor to understand how pressure affects the process.
The instrument shines an infrared beam at a sample, and molecules respond with their own absorption pattern, like bells of different tones. This pattern, the spectrum, holds information about the chemical composition. But to read it, a specialist usually consults a library of reference records, which is slow and not always possible.
A light beam usually travels in a straight line, but you can make it spin around its axis, like water swirling into a vortex as it drains. This 'twisted' light carries more information and is needed for ultra-fast communication and quantum computing.
Two spinning tops whirl so close they nearly touch. One is scorching blue, the other dim white. Together they complete a full orbit in twenty hours. This is the pair Feige 64: a blue star with a mass of just a third of the Sun's, and a white dwarf, the cooled core of a former star, one and a half times heavier than our Sun.
The blue star seems too hot for its mass.
A stone thrown into water quickly loses speed. A meteor entering the atmosphere should behave the same way: air slows it down, and friction burns up its material. But cameras of the Global Fireball Observatory network have captured hundreds of bright fireballs over ten years that streak across the sky with almost no deceleration.
Electricians working with high voltage are like divers: they need to see what's happening deep underwater without going down themselves. What's needed is a sensor that stays away from the dangerous current and relays information to the surface. Usually, light is used: a beam passes through a transparent crystal, and the electric field slightly rotates it.
Two stars circle each other like dancers who come together and drift apart. Over time, one swells, and its outer layers spill onto its neighbor. The star that receives foreign matter looks no different from a single star, but its surface remembers everything.
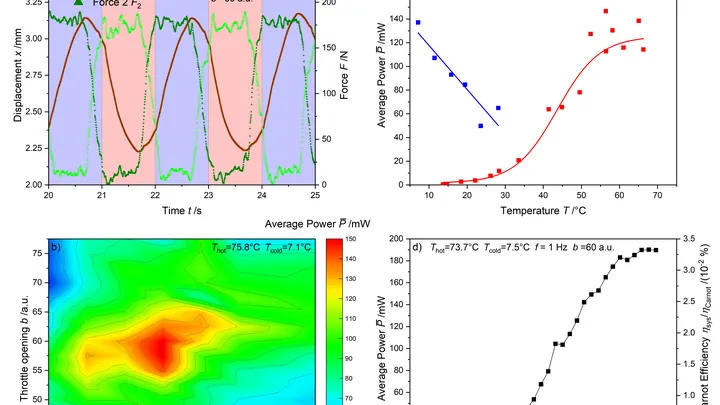
Hot water after a shower, warm air from ventilation, the heated walls of an engine — all this is heat below 100°C. Usually, it dissipates without doing any useful work. Now it can be captured and turned into electricity.
Inside the new device is a wire made of a nickel-titanium alloy. This material remembers its shape: when heated, it contracts; when cooled, it returns to its original shape.
In the kitchen, when a pan heats up, your hand feels the heat before you even touch it. A solar telescope picks up similar invisible heat — only from a star, not a stove. The instrument, called HATS, captures radiation in the terahertz range, which was previously little studied due to technical difficulties.
An ordinary flashlight shines in all directions, and after just a couple of dozen meters its beam fades so much it barely lights a wall. The atmosphere scatters light, and wind and heat currents distort it even more. But if you lay an invisible pipe for light right in the air, the beam will travel through it like water through a hose.
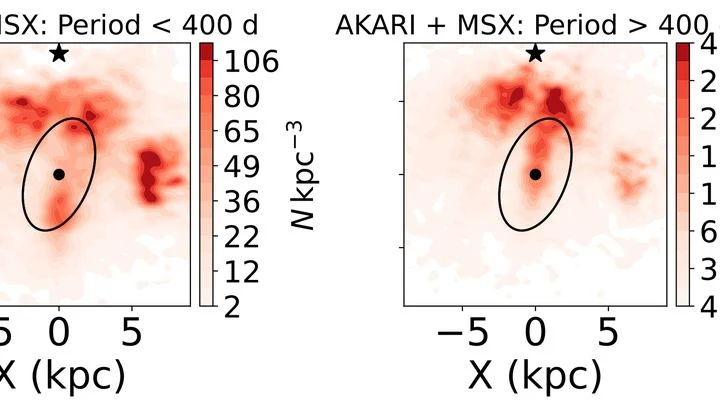
Red giants in the center of the Milky Way resemble distant lighthouses that brighten and dim. Their light pierces through dense dust, but standard distance-measuring methods fail here: the stars are too bright and unstable, and dust distorts the picture.
Astronomers found a workaround.
An electron beam is a stream of tiny particles carrying an electric charge. When such a beam hits a material, it doesn't just heat it or knock out atoms: it also gives the surface a slight push, like a jet of water pushing against your palm.