How Bayesian Methods Uncover Hidden Rhythms in Data
When we look at a plot of temperature over a year, we see waves: warmer in summer, colder in winter. These waves are the rhythms of the data. But sometimes the rhythms are not so obvious: for example, wind speed can vary every 12 hours due to tides. Simple models describe the overall shape of the waves well, but if the real data are more complex, the model makes mistakes. Complex models are more flexible, but they often smooth out sharp peaks, and we lose important details.
The new method works like an artist who first makes a rough sketch with a simple model and then adds details with flexible correction. First, the data are described by a vector autoregression (VAR), a model where the current value depends on past values. Then, in the frequency domain (where the data are decomposed into waves of different lengths), a correction matrix is introduced. It fixes the errors of the simple model. This matrix is given a flexible distribution that allows it to adapt to the data.
In tests, the method was compared with purely simple and purely complex models. When the simple model was correct, the new method was almost as accurate as the complex one. When the simple model was wrong, the new method outperformed both: the error was 0.081 versus 0.097 for the complex model and 0.156 for the simple one. This means the method is reliable in different situations. It was applied to climate data (the Southern Oscillation Index) and wind speed, and in every case it found hidden rhythms that other approaches missed. Now researchers have a tool that combines the accuracy of the simple with the flexibility of the complex.
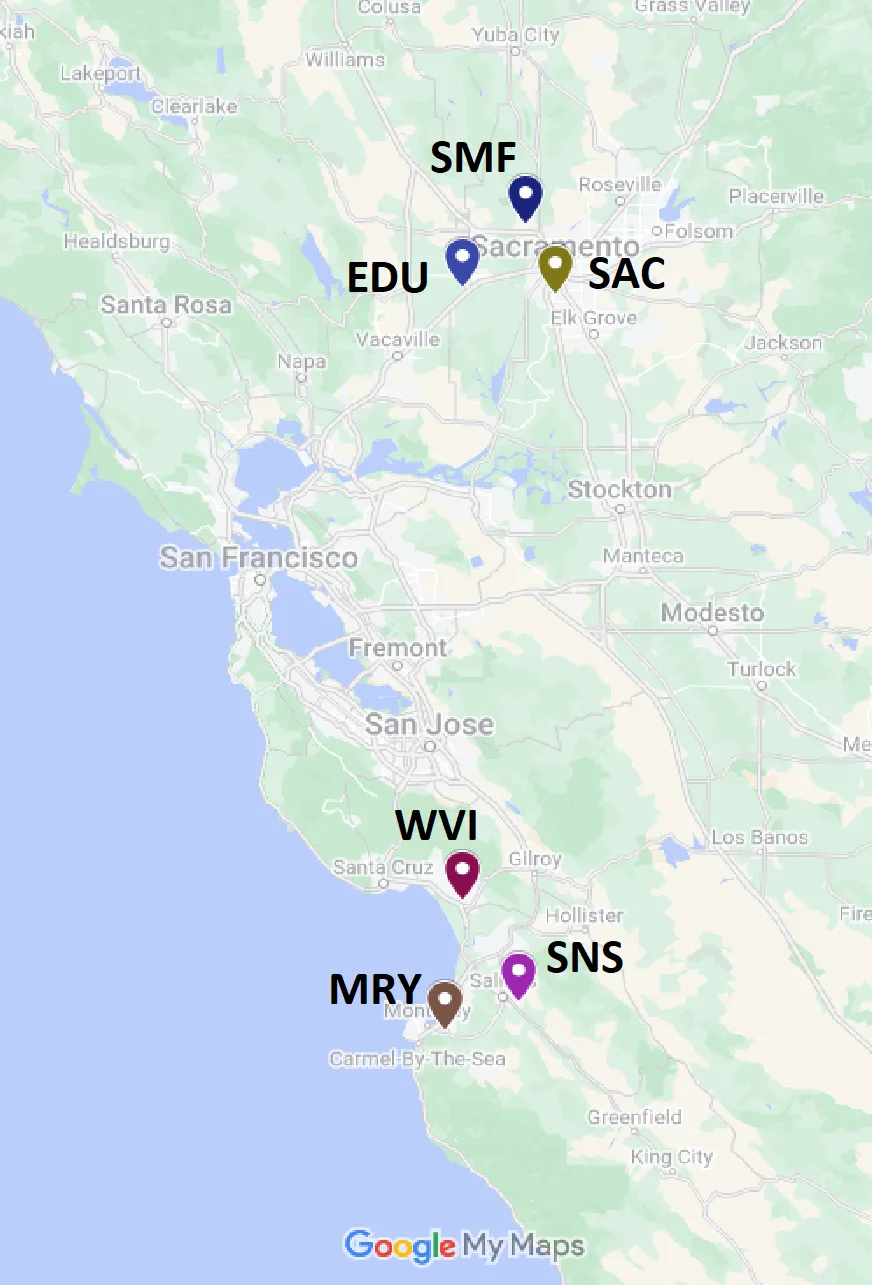
The method was applied to wind speed data from six California airports and detected a diurnal peak at a frequency of about 0.524 radians, corresponding to a period of 12 hours, that is, a semidiurnal cycle, which had been smoothed over by other methods. This shows how important it is to preserve sharp spectral features.