Hybrid Spectral Analysis: How a Bayesian Method Combines the Precision of Parametrics with the Flexibility of Nonparametrics
A rough sketch of a portrait: a few confident lines define the shape, but the details are not yet refined. That is how a parametric model, such as vector autoregression (VAR), describes a time series: it captures the main structure, but if the real data deviate from its assumptions, the portrait comes out distorted. A nonparametric approach is like freehand drawing without strict rules: it is flexible, but it often smooths over sharp features, losing important details. The new method takes the parametric sketch and refines it into an accurate picture, adding nonparametric touches in the frequency domain.
The idea is simple: take a VAR model for the data in the time domain, then correct it in the frequency domain using a correction matrix. This matrix multiplies the Fourier coefficients and fixes possible model misspecification. The correction matrix is constructed as the ratio of the square roots of the true spectral density and the spectral density of the parametric model. It is assigned a flexible Bernstein–Hpd–Gamma prior, which is a multivariate generalization of the Dirichlet process. This allows the method to adapt to the data without assuming their exact form in advance.
In simulations, the method was compared with a purely parametric VAR and a purely nonparametric approach based on the Whittle likelihood. When the parametric model was correct, the new method showed accuracy close to the nonparametric one, but the parametric remained slightly better. When the model was misspecified, the new method outperformed both: the L1 error was 0.081 versus 0.097 for the nonparametric and 0.156 for the parametric. The coverage of 90% confidence regions reached 0.888, whereas for the nonparametric it was 0.594, and for the parametric 0.980 (but with excessive width).
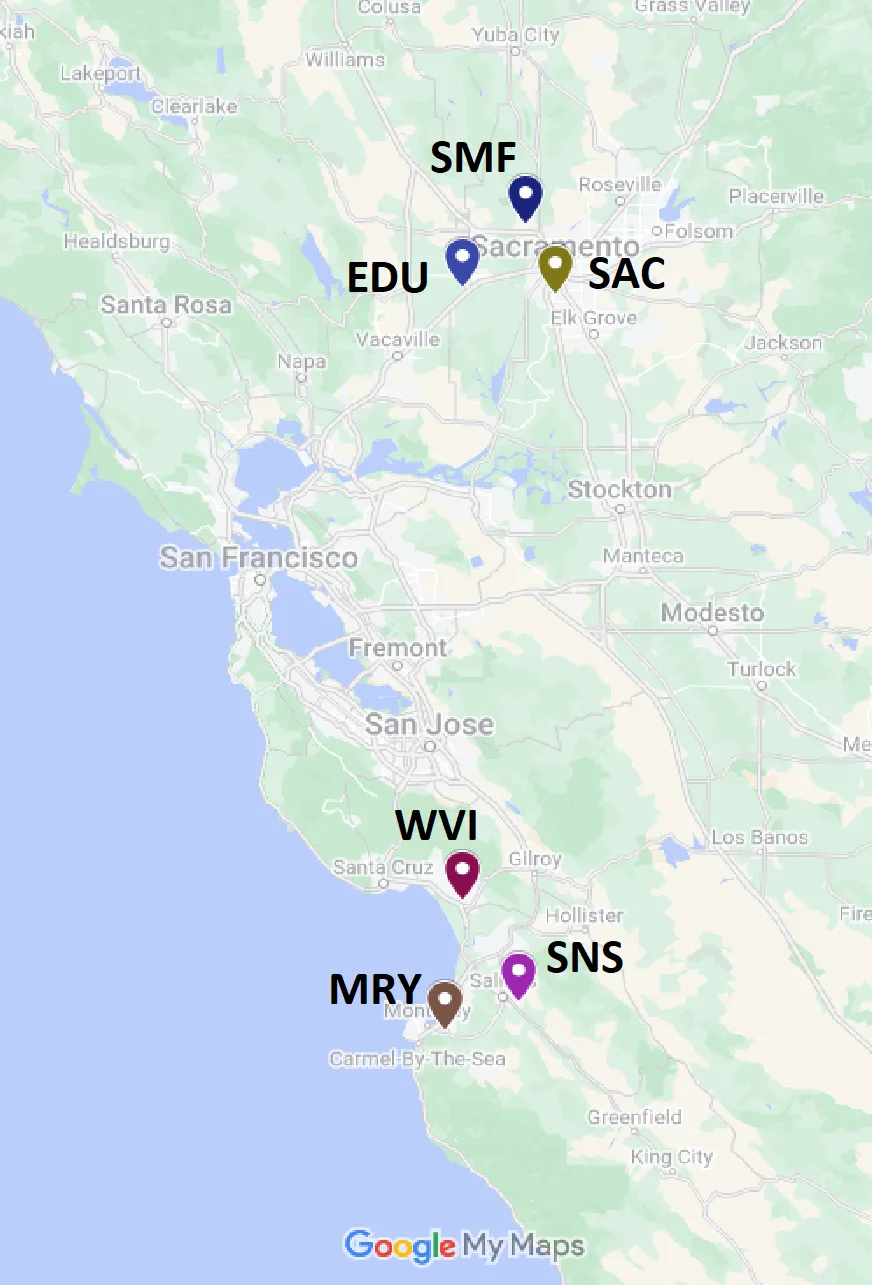
Application to the Southern Oscillation Index (453 months of data) and wind speeds at six California airports confirmed that the method identifies the annual peak in SOI and the diurnal peak in wind, which other approaches blur. This makes it useful in climatology, econometrics, neuroscience, and signal processing, where both accuracy and robustness to model misspecification are important. The rough sketch turns into a detailed portrait: the parametric basis provides structure, and the nonparametric correction adds realistic features without blurring sharp edges.
The method was applied to wind speed data from six California airports and detected a diurnal peak at a frequency of about 0.524 radians, corresponding to a period of 12 hours, that is, a semidiurnal cycle, which had been smoothed over by other methods. This shows how important it is to preserve sharp spectral features.