Jackknife resampling is a statistical technique for estimating the bias and variance of an estimator without making strong assumptions about the underlying distribution. The idea is simple: repeatedly recompute the estimator while leaving out one observation at a time. By comparing these 'leave-one-out' estimates to the full estimate, you can quantify how much each observation influences the result and get a measure of uncertainty.
History
The jackknife was introduced by Maurice Quenouille in 1949 and further developed by John Tukey in the 1950s, who gave it its name—a reference to the multi-purpose tool, as the method is versatile and simple.
How it works
Given a dataset of n observations, you compute the statistic of interest (e.g., the mean, median, or a regression coefficient) n times, each time omitting a different single observation. This yields n 'jackknife' estimates. The average of these estimates, compared to the full-data estimate, gives an estimate of bias. The variance of the jackknife estimates, scaled by (n−1)/n, provides an estimate of the standard error. The method is computationally cheap and works well for smooth statistics, though it can be less reliable for non-smooth ones like the median.
In practice
Used in ecology (estimating species diversity indices), economics (estimating regression coefficients), and machine learning (evaluating model stability), especially when analytical formulas for standard errors are unavailable.
Fun fact
The jackknife is a special case of the bootstrap, but it is deterministic—unlike the bootstrap, which uses random resampling, the jackknife always gives the same result for a given dataset.
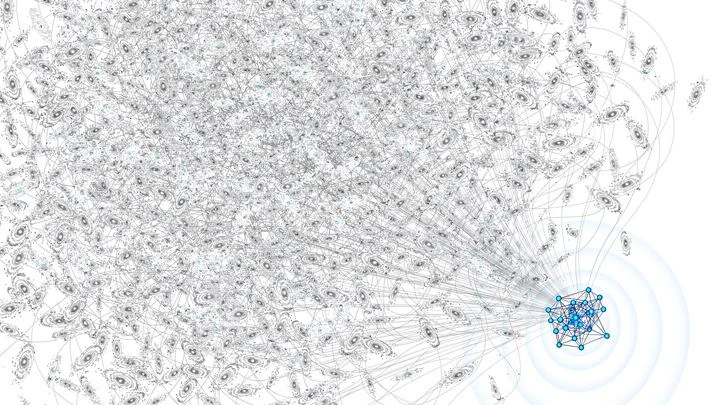
The orchestra plays without a conductor. Each instrument follows its own schedule: the violin on Monday, the flute on Wednesday, the timpani on Saturday. Astronomers hear not music but isolated notes scattered across the calendar. A telescope sees a star only when it is above the horizon and when the schedule has allotted time for it.
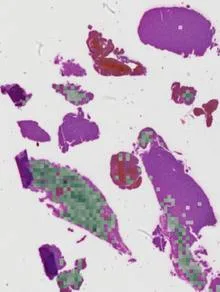
Imagine trying to figure out what happened in a room from the sound that lingers after a gunshot. The shot is gone, but the echo still bounces off the walls. That's roughly how a neuropathologist views a brain tissue section where the tumor itself is absent: the biopsy only captured healthy tissue that reacted to the disease.
4 610 universes — that's exactly how many cosmological models astrophysicists needed to show that the familiar Gaussian mask no longer works for next-generation data. Future sky surveys, such as the Euclid mission and the Vera C.
A typical cardioid microphone, like an ear, hears best from the front, but its readings blur when sound comes from the side. The solution is to gather several such 'ears' into a sphere. You get a sound ball that picks up signals from all directions. By comparing measurements, the system breaks down errors into simple components — much like spectroscopy splits light.
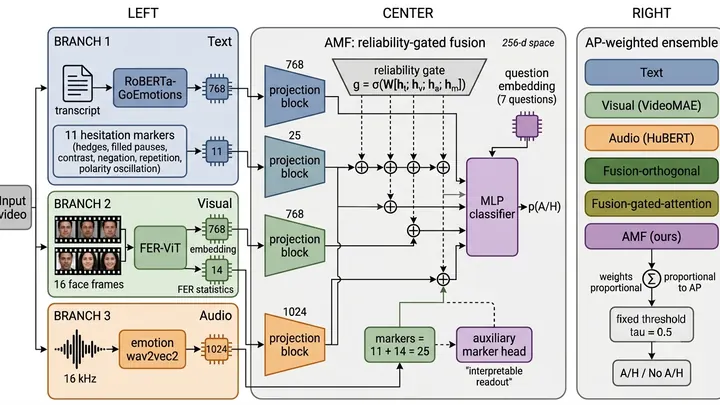
A new system analyzes a short interview to recognize human doubt by combining text, voice, and facial expressions. But the main key to uncertainty turned out to be the dark matter of speech — pauses and filler words that standard speech systems erase like a black hole.
The standard way of digitizing speech: taking volume readings thousands of times per second. It's like tasting broth with a teaspoon: each sip is watery, with almost no detail. The data stream swells, though the substance is minuscule.
Scientists proposed first "simmering down" the audio signal.
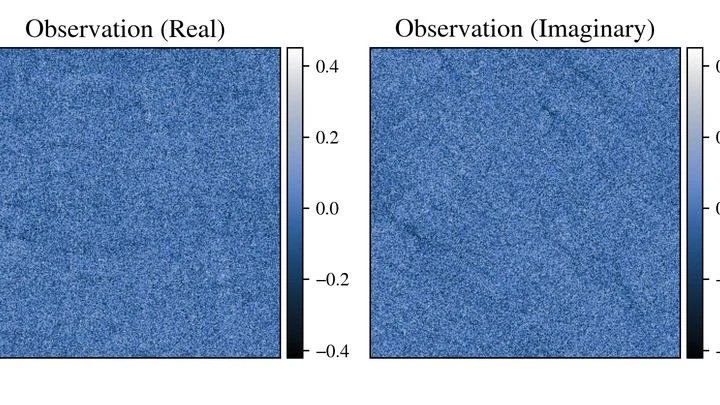
Look into the night sky — before you is not a scattering of lights, but a multi-layered manuscript. Under the bright ink of stars and galaxies appears a faded, almost erased text.
60 mice, 1,980 samples, 234 lung cancer patients. Behind each number lie thousands of genes. Their activity is measured to understand the disease. But the data aren’t uniform: for one patient, you assess a protein level (a continuous number), make a diagnosis (yes/no), and determine the tumor subtype (a category).
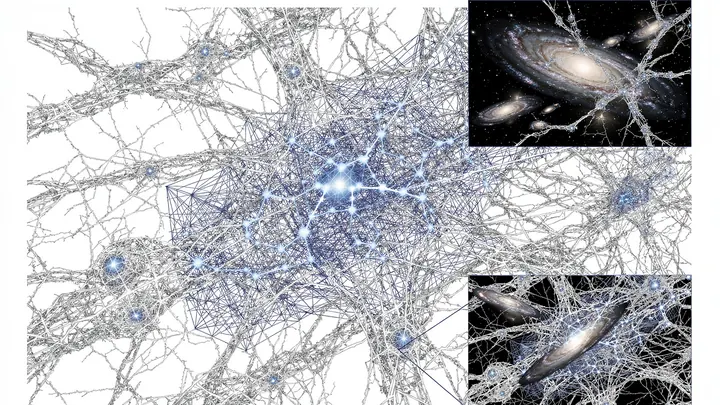
Light from distant galaxies travels to us for billions of years, but along the way it gets bent and twisted by the invisible web of dark matter. This effect, predicted by Albert Einstein within general relativity, is called gravitational lensing.
A lab robot counts molecules, and gets it wrong. One tube shows 0, another 12, a third 3, though in reality they all hold roughly the same amount. Such 'raw' numbers are common in biology: DNA sequencing, counting species in a water sample, gene activity. There's plenty of data, but it's sparse and more scattered than simple randomness would predict.
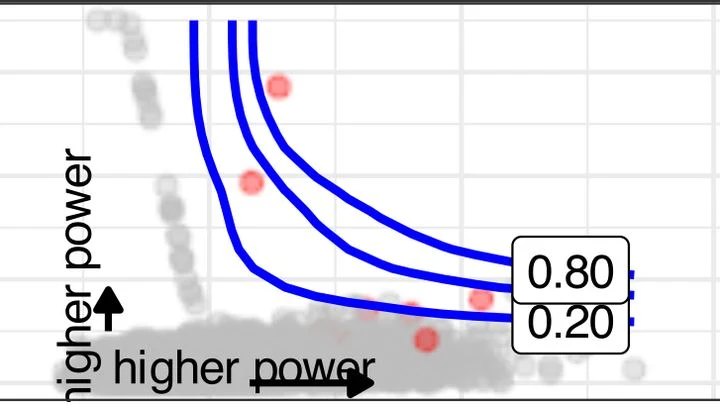
When you're planning a renovation, you don't buy paint by eye: you measure the wall area. In science, deciding how many samples to collect is a similar guess, but the stakes are higher. Skimp on samples, and your study becomes a lottery: you might miss a real effect, or you might mistake noise for a discovery. Overshoot, and you're wasting tubes, months, and, in animal experiments, lives.
Picking out a single faulty microchip from a million, without any clue what the fault looks like, is a classic needle-in-a-haystack problem. A classical computer would test each chip one by one.
A camera takes a snapshot, but the sensor is noisy, the optics blur, and some pixels are overexposed. Reconstructing the original picture is like guessing a melody from a scratched record: there are many possibilities, and which one is true is unclear.
A neutron spectrometer is like a blind geologist who taps on rock and guesses what's inside by the sound. It sends a beam of neutrons into a crystal and watches how they scatter. From this pattern, you can deduce how atomic magnets, spins, oscillate. But where exactly to dig and how long to listen used to be decided by a human.
Now, the TAS-AI algorithm has taken the helm.
Hunting for a single glowing spot in a dark sample is like trying to find a needle in a haystack: the microscope beam crawls line by line, wasting time and light. Physicists replaced this slow sweep with random light patterns. The sample is illuminated with a broad field, but each time with a new pattern of bright and dark patches, as if random shadows from a grid were projected onto it.
A magnetic field is invisible, but you can make it 'glow' using tiny defects in diamond — nitrogen-vacancy centers. Each such defect acts as a miniature compass, telling you which way the field points. The problem is that there are many of these compasses, and reading them all in sequence is like transcribing every letter in a thick book by hand.
Old weather records hold surprises: the thermometer suddenly jumps by half a degree, not because of the weather, but because the station switched instruments. Such abrupt shifts in data are called changepoints, and separating them from genuine climate signals is a challenge statisticians grapple with.
A rough sketch of a portrait: a few confident lines define the shape, but the details are not yet refined. That is how a parametric model, such as vector autoregression (VAR), describes a time series: it captures the main structure, but if the real data deviate from its assumptions, the portrait comes out distorted.
Imagine an interpreter who gets distracted by every rustle in the hall. The more rustles, the more errors in the translation, even though the meaning of the speech hasn't changed. The same happens with data: if measurements are unevenly spaced, standard analytical tools start "hearing" changes that never occurred in the underlying process.
A translator who jumps at every rustle in the hall starts mixing up words by the end of the meeting. Their confidence in being right grows, while their accuracy drops. That is roughly how poorly calibrated probabilistic forecasts behave: the model claims a high probability for an event, but reality disagrees.