The Southern Oscillation Index (SOI) is a simple yet powerful metric used to monitor the state of the El Niño-Southern Oscillation. It is calculated from the difference in sea-level atmospheric pressure between Tahiti (in the central Pacific) and Darwin (in northern Australia). Because these two locations sit on opposite sides of the tropical Pacific, the pressure difference reflects the strength of the Walker circulation—the large-scale east-west atmospheric flow that drives trade winds. A sustained negative SOI indicates El Niño conditions, while a sustained positive SOI indicates La Niña conditions. The index provides a long, continuous record that helps scientists track ENSO variability over decades.
History
The index was developed in the 1930s by Sir Gilbert Walker, who used pressure readings from these two stations to study the Southern Oscillation, though the term 'Southern Oscillation Index' came into common use later.
How it works
The SOI is computed by taking the standardized difference between the monthly mean sea-level pressure anomalies at Tahiti and Darwin. Standardization removes seasonal cycles and makes the index comparable across months. When pressure is higher than normal at Tahiti and lower at Darwin, the SOI is negative, corresponding to weakened trade winds and El Niño. Conversely, when pressure is lower at Tahiti and higher at Darwin, the SOI is positive, indicating stronger trade winds and La Niña. The index is smoothed over several months to filter out weather-scale noise and reveal the slower ENSO signal.
In practice
The SOI is used by meteorological agencies and researchers as a real-time indicator of ENSO phase, complementing sea surface temperature indices, and it feeds into seasonal outlooks for rainfall and temperature.
Fun fact
The SOI can be so sensitive that a single month's value can swing dramatically, but a three-month running average is often used to distinguish genuine ENSO events from random atmospheric fluctuations.
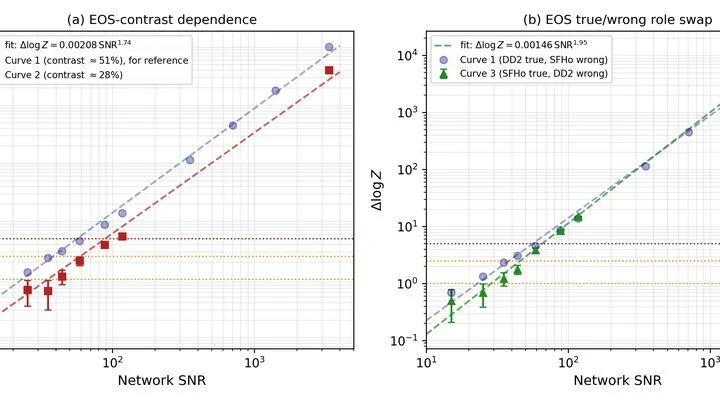
The merger of two neutron stars is not just a collision. Even before they touch, they deform each other through tidal forces, and this deformation depends on how 'soft' or 'stiff' the matter inside is. Stiff matter resists more; soft matter changes shape more easily.
Every year, as December approaches, the water off the coast of Peru becomes anomalously warm or anomalously cold. This is El Niño and La Niña, two phases of the same climate pendulum that swings in the equatorial Pacific. The pendulum is not a simple one: it remembers what happened to it several months earlier, and this memory determines which way it will swing next.
A tuning fork produces a pure tone, but if you strike it too hard, it starts to rattle, and a musician might mistake that rattle for complexity in the sound.
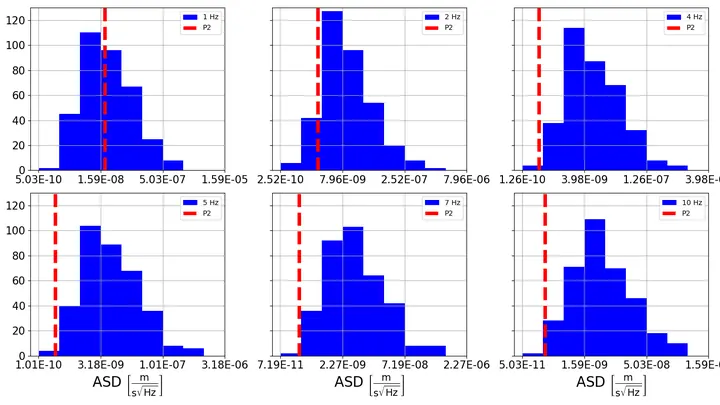
A giant musical instrument hides underground. It picks up not sound but the trembling of space itself — gravitational waves from the mergers of dead stars. But this instrument has a problem: it is bothered by Earth's 'breathing.' Winds, storms, even the changing seasons make the ground vibrate, creating noise.
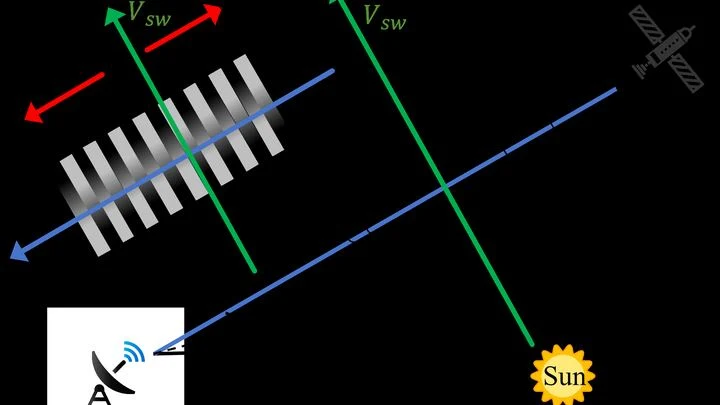
A radio signal travels from Mars to Earth, but on the way it has to push through the invisible "wind" of charged particles blowing from the Sun. This wind, like ripples on water, slightly distorts radio waves.
The solar wind isn't a smooth flow: it's gusty. Inside it, protons and helium nuclei don't all travel at the same speed; they spread out like droplets in a hose stream. Usually, this spread is described by a simple bell-shaped curve.
By day in Chile's Atacama Desert, the air shimmers with heat like the haze above a hot skillet. Sunlight passing through this shimmer begins to dance and flicker. Astronomers call this airy trembling "seeing" — and it keeps telescopes from getting a sharp view of the stars.
To fight this nuisance, engineers have built a special instrument — a solar seeing monitor.
A barometer on Tahiti and one in Darwin, Australia, breathe in opposite phases. When pressure rises on one, it falls on the other, and this difference, known as the Southern Oscillation Index, serves as a pendulum for the global climate.
The placenta is like a bustling market where oxygen passes from mother to child. If the stalls are neatly arranged and goods are delivered quickly, everyone gets enough. But when the aisles get clogged, traffic jams start: some places are crowded, others empty.
Radio waves passing through the solar corona, the outer atmosphere of the Sun, are distorted just like the air shimmers over scorching asphalt. This haze is caused by seething streams of charged particles — the solar wind.
A star like the Sun doesn't just shine: it hums quietly. Inside, plasma churns, and these motions make the surface rise and fall rhythmically. Catching such a tremor from Earth is nearly impossible: it gets lost in the noise of the atmosphere and the instrument itself. That's why astronomers listen to stars from space, where it's quieter.
The Sun is not a calm sphere. Waves constantly ripple through its interior, like a bell after being struck. These oscillations reach the surface and reveal what's happening on the far, invisible side. Astronomers have long been able to 'listen' to this ringing and find large sunspot groups there.
Heat a crystal, and its atoms start to tremble more vigorously, like strings tightened or loosened. In a LaCoO3 crystal (a compound of lanthanum, cobalt, and oxygen), heating from 2 to 650 K triggers two major rearrangements: around 100 K, the magnetic state of cobalt ions changes, and around 550 K, the material transforms from an insulator into a…
The scorching gas streaming from the Sun is not a continuous flow but rather a soup of charged particles. In this soup, waves constantly boil up: electric fields flare and fade like ripples on water from a tossed stone. One such wave is the ion-ion acoustic wave.
The solar wind isn't a calm stream but a bubbling soup of charged particles. Diving close to the Sun, the Parker probe picked up two types of stirring waves. Left-handed ones, like a whisk in a chef's hand, whip up the material when the temperature differs along and across the flow.
The Pacific Ocean spans half the planet, and its mood decides whether India gets rain or Australia gets drought. In the center of this giant, in a region that climatologists call NINO3.4, water temperatures rise and fall, affecting millions of lives.
Every summer, the same scene unfolds over India: clouds driven from the ocean by the wind release their rain, and how that rain falls on the fields determines the harvest for more than a billion people. Meteorologists have long tried to reduce this mosaic to a single number, the all-India rainfall index, which averages millimeters across the country.
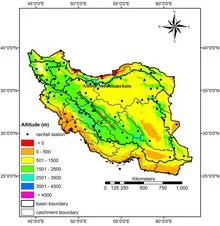
In 2019, northern and southwestern Iran received 50% more rainfall than usual, and rivers overflowed their banks. A year earlier, in 2018, rainfall was 53% below normal, and fields cracked under drought. Such swings are not random; they are responses to three distant oceanic pulses that set the rhythm for Iran's rains.
Winning the lottery changes the winner's life, but for the statistics of all players it means almost nothing: the probability of winning is negligible, and the average winnings per ticket remain tiny.
Every summer, the same performance unfolds over the Indian Ocean: moist air rushes from the sea onto the scorched land, bringing rains that billions of people depend on.
For a century, climatologists have measured the ocean's pulse with a barometer. Indices like El Niño or the North Atlantic Oscillation are built on atmospheric pressure differences between two points, and then we wonder why rivers don't obey.
Over the tropical Pacific, air pressure breathes with periods from two to fourteen years. The barometer on Tahiti rises while it falls in Darwin, Australia, and the entire planet's climate shudders: El Niño arrives. Meteorologists call this the Southern Oscillation and have tracked it for 138 years, but until now they couldn't answer a simple question: where do such periods come from?
On April 16, 2012, Washington experienced heat no one expected. The thermometer climbed 18 degrees above normal. Sixty days earlier, Bucharest and Kyiv had weather unusual for them. The link between these events was found by an algorithm that scans pairs of cities worldwide, looking for recurring coincidences.
In 1997, the Pacific Ocean off the coast of Peru warmed so much that fish disappeared and torrential rains hit the desert. This is El Niño, a warm current that every few years changes weather across the planet. Predicting its arrival six months ahead is already possible, but looking further is like guessing a ship's route from a single point on a map.
A pendulum swings steadily until gusts of wind disturb it. Each push shifts the rhythm slightly, and soon the beats no longer match the metronome. Natural oscillators live the same way: the heart, populations, climate cycles—they all oscillate, but randomness constantly interferes.
A forest fire has no "typical" size: a small grass burn and a firestorm covering thousands of hectares are part of the same phenomenon. The same goes for tropical cyclones: the energy they release over their lifetime does not cluster around some average value. Instead, it follows a power law, and this rule holds across all of Earth's oceans.
A barometer on the island of Tahiti and a barometer in the Australian city of Darwin show different pressures. Subtract one from the other, and you get a number that climatologists call the Southern Oscillation Index. It changes every day, but within these daily jumps hide steady rhythms, just as the beats of a metronome hide within the noise of an orchestra.