A statistical method is a formal procedure for collecting, analyzing, and interpreting data that is subject to random variation. In physics, these methods are essential because measurements are never perfectly precise; they are always affected by noise, instrumental errors, and quantum fluctuations. Statistical methods provide a framework for quantifying this uncertainty, estimating the true value of a quantity, and determining the probability that a hypothesis is correct given the observed data.
Statistical methods are used everywhere in physics, from analyzing particle collision data at the Large Hadron Collider to determining the cosmological parameters from cosmic microwave background measurements, and in medical physics for designing clinical trials and interpreting imaging data.
Fun fact
The discovery of the Higgs boson in 2012 was only accepted after the data reached a statistical significance of '5 sigma', meaning the probability that the observed signal was due to random chance is less than about one in 3.5 million.
A star blinks every 38 seconds. This is no random twinkle: inside the white dwarf WD 0158−160, steady oscillations run like the beats of an invisible metronome. From the rhythm of those beats and the star's precise distance, astronomers have computed its mass and temperature — without ever looking at its spectrum.
A kitchen mixer runs at a single speed, but start jabbing the button and the mixture whips up differently. Chemical reactions behave much the same way when the rates of their individual steps are not constant but pulse over time.
A tightrope walker steps onto the wire. Every move is a calculation: shift your weight just right, or you’ll fall. In the world of quantum particles described by the Dirac equation, there’s a different kind of abyss — the wave function’s furious oscillations.
When you're planning a renovation, you don't buy paint by eye: you measure the wall area. In science, deciding how many samples to collect is a similar guess, but the stakes are higher. Skimp on samples, and your study becomes a lottery: you might miss a real effect, or you might mistake noise for a discovery. Overshoot, and you're wasting tubes, months, and, in animal experiments, lives.
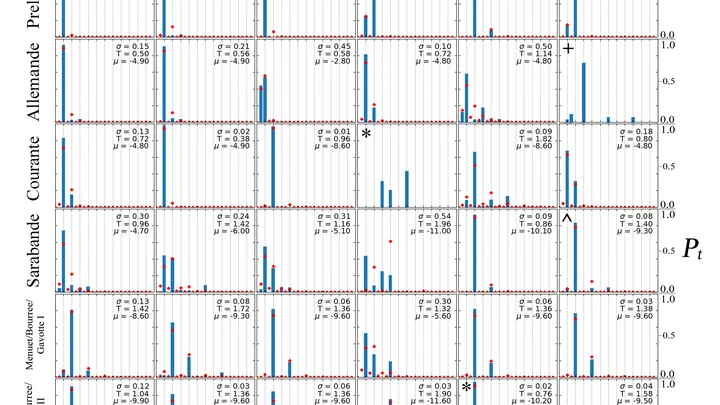
Music relies on repetition: we expect the beat to return, like a chorus coming back. But if you repeat the same thing for too long, it gets boring. The composer seems to walk a tightrope between the familiar and the unexpected.
Scientists translated this balance into the language of physics.
During a course of radiation therapy, the tumor and surrounding tissues can shift or change size. Doctors regularly take images and sometimes adjust the plan to keep the radiation on target. But how do you know how much dose has already been delivered and how much is still to come? Usually, this is estimated using simple rules that don't account for uncertainty.
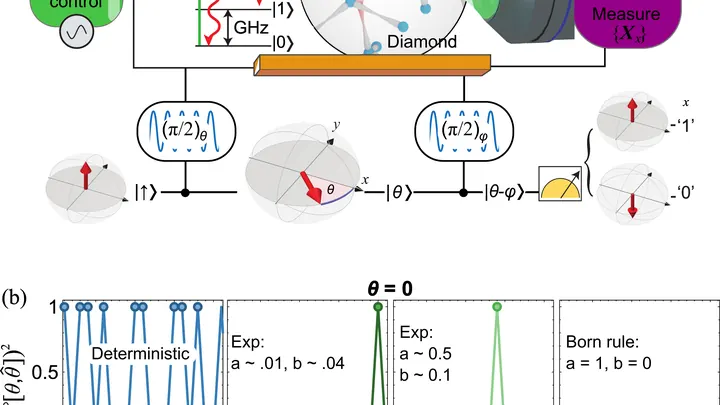
A coin toss seems random, but in reality, physics decides everything: the force of the throw, air resistance, the surface's elasticity. If you knew all the details, you could predict the outcome. True randomness lives deeper — in the quantum world.
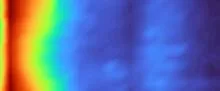
The heart beats, and on a paper ECG strip, each beat looks like a sharp spike with two humps: a quick rise, then a smaller wave, then a descent. A doctor looks at such a strip and sees the rhythm, but the shape of each spike, how exactly the muscle contracted, is hard to discern, especially if the recording lasts a full day.
This new method turns that strip into a colorful carpet.
Our body's tissue is like a city: different neighborhoods are home to different cells, each with its own job. To understand how this city is organized, biologists take images showing which genes are active at each spot. But sharp images are expensive, and cheap ones come out blurry, like a photo of a city from high above, where individual buildings are hard to make out.
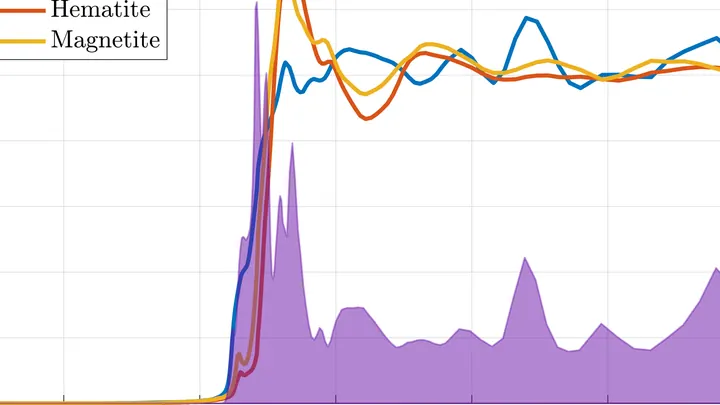
A chemical map of a sample is like a mosaic: each point has its own color, its own chemical composition. To assemble such a mosaic, a spectromicroscope scans the sample point by point, recording a spectrum at each location — a "fingerprint" of how the material absorbs or emits light.
A neutron star is a sphere the size of a city, but it weighs as much as one and a half Suns. Inside such a sphere, matter is so compressed that a teaspoon of it would weigh billions of tons. But physicists don't fully know what this matter is made of.
A translator in a conference room hears not only the words but also the echo of previous phrases still bouncing around the ceiling. If they get distracted by every reverberation, an hour of conversation turns into two. Similarly, a complex system, whether an ocean or a power grid, receives random jolts that do not vanish instantly but drag behind them a tail of memory.
In the tropical Pacific Ocean lives a giant pendulum: warm water swings from Australia to South America and back, and each swing changes weather across the entire planet. This pendulum is called El Niño–Southern Oscillation, and its behavior resembles a capricious conductor: sometimes it waves the baton sharply, sometimes slowly, and sometimes it freezes, confusing forecasters.
A rough sketch of a portrait: a few confident lines define the shape, but the details are not yet refined. That is how a parametric model, such as vector autoregression (VAR), describes a time series: it captures the main structure, but if the real data deviate from its assumptions, the portrait comes out distorted.
A translator who learns to correct their own slips works more accurately. In the world of forecasting noisy processes, a new method takes on this role: a reservoir computer that adds a random correction to its prediction at each step.
Imagine an interpreter who gets distracted by every rustle in the hall. The more rustles, the more errors in the translation, even though the meaning of the speech hasn't changed. The same happens with data: if measurements are unevenly spaced, standard analytical tools start "hearing" changes that never occurred in the underlying process.
The ice cover of a river looks solid, but beneath it lie cracks that alter the flow. So it is with a time series: behind the smooth surface of numbers hide moments when the rules of the game change. These moments are called change points, and finding them is like tapping the ice to locate weak spots.