The posterior distribution is a fundamental concept in Bayesian statistics that represents the updated probability distribution of model parameters after incorporating observed data. It combines prior beliefs about the parameters with the likelihood of the observed data, yielding a complete probabilistic description of what is known about the parameters after seeing the evidence. This distribution is central to Bayesian inference, as it allows researchers to make probabilistic statements about parameters and quantify uncertainty in a principled way.
History
The concept of the posterior distribution dates back to Thomas Bayes' work in the 18th century, published posthumously in 1763, and was further formalized by Pierre-Simon Laplace in the early 19th century.
How it works
The posterior distribution is computed using Bayes' theorem: the posterior is proportional to the prior distribution multiplied by the likelihood function. In practice, for complex models, the posterior is often not analytically tractable, so computational methods such as Markov Chain Monte Carlo (MCMC) or variational inference are used to sample from or approximate it. The resulting distribution can then be summarized using statistics like the mean, median, or credible intervals, which provide a range of plausible parameter values given the data.
In practice
Posterior distributions are used in virtually every field that involves statistical inference, including astrophysics (estimating neutron star properties from gravitational wave signals), medical imaging (reconstructing images from noisy data), and machine learning (Bayesian neural networks).
Fun fact
In the context of gravitational wave astronomy, the posterior distribution for the masses of merging black holes can be so tightly constrained that it allows researchers to determine the redshift of the source with an uncertainty of only a few percent.
A translator learns a language not from a dictionary but from living conversations: they hear fragments of phrases, street noise, different accents. Out of that chaos they assemble rules that are written in no book.
An interpreter gets distracted by every rustle in the hall, and a one-hour meeting stretches into two. Similarly, molecular foundation models learn the language of molecules from vast corpora, but each new conversation requires fine-tuning. Monroe changes the rules: it doesn't learn a new language but instantly finds common meaning from a few examples.
When two heavy nuclei smash into each other at enormous speeds, they don't collide as whole objects like billiard balls. Only part of their matter comes into contact. How many nucleons (protons and neutrons) actually took part in the collision, and how many flew past, is not known in advance. All subsequent measurements depend on this number, but it cannot be observed directly.
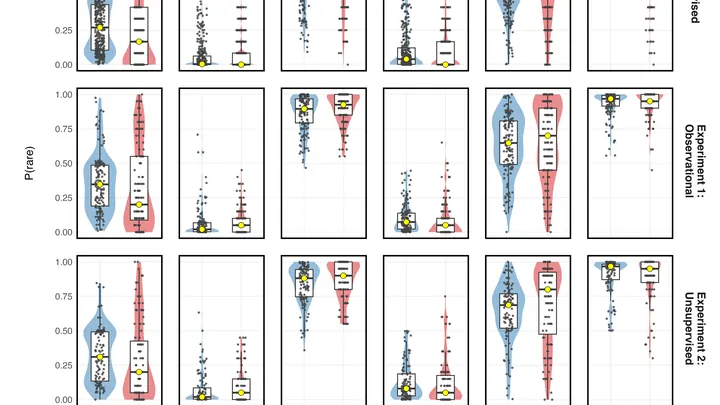
In a warehouse, there are boxes of apples and pears. There are many apples and few pears. But when the stock clerk says "a fruit with smooth skin," we are somehow more likely to recall the rare pear than the common apple. This is the inverse base-rate effect — a persistent glitch in how the brain resolves ambiguity between categories.
A cosmic "caliper" will soon measure a neutron star to within a hundred meters. For an object a couple dozen kilometers across, that's like measuring the thickness of a human hair from a kilometer away.
A neutron star is the remnant of an exploded supernova.
In 1998, mathematician David Boyd noticed something strange. He was studying the Mahler measure of polynomials, a quantity that gauges the "complexity" of their roots, and found that for a family of curves, it always equals a special rational number times the derivative of an L-function.
A Dictyostelium amoeba crawls across glass. Its path is recorded — a chain of points on a plane. But what forces are pushing it? Inside the cell, a molecular motor works: proteins pull, the membrane springs, water presses.
Two hundred million stars. In the heart of the Galaxy, where the future survey by the Nancy Grace Roman telescope will aim, about 250 times during its mission the light of one of them will flicker at an invisible touch.
Reconstructing a full picture from fragments is like discerning an orchestra's melody in a noisy hall. Such challenges arise in photometry, where a star's brightness is recovered from faint twinkling. Traditional methods need precise noise information, which is almost always unknown.
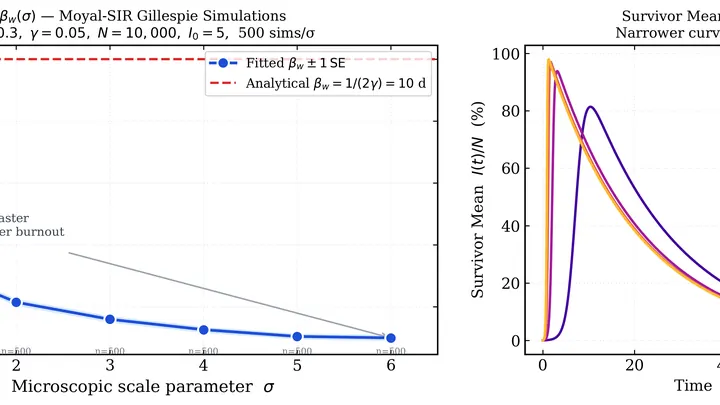
Ordinary models assume that infection is like a steady flow of water that washes over everyone equally. In reality, the stream from a sick person fluctuates: right after infection it barely trickles, then turns into a raging downpour, and later subsides. The chance of catching the virus depends on the strength of this flow at the moment of contact.
Look into the night sky — before you is not a scattering of lights, but a multi-layered manuscript. Under the bright ink of stars and galaxies appears a faded, almost erased text.
On a topographic map, raindrops choose their path: falling on one slope, they flow into River A; on the other, into River B. An observer sees only the winding rivers (the response variables Y) and knows which slope the water came from (the instrument Z), but cannot see the drops themselves (the unobserved factors ε).
Light from distant galaxies travels to us for billions of years, but along the way it gets bent and twisted by the invisible web of dark matter. This effect, predicted by Albert Einstein within general relativity, is called gravitational lensing.
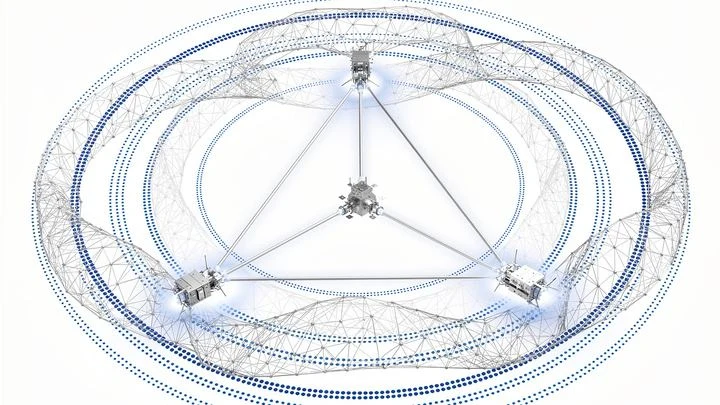
The Universe is not silent: it is filled with a continuous gravitational-wave hum. In a decade, the LISA space observatory will tune its "ears" to the millihertz range, and the richest source will be our Galaxy — tens of thousands of white dwarf pairs whirling in a frantic dance.
Biological complexity has long eluded us: you can count genes, cells too, but how do you grasp the organization of the proteome itself — a multi-thousand ensemble of proteins woven from carbon, oxygen, and hydrogen?
Your hand rests on the table, and two short vibrations arrive at your wrist — one after the other. You need to say which is stronger. The task seems simple, but the answer depends on which vibration came first. If the first is weak and the second is strong, the difference feels larger than when they are swapped.
An album with hundreds of family photos holds countless stories. If you look at each picture on its own, you might easily decide that Uncle is a real giant: that day he happened to stand a step higher than everyone else. But flip through the whole album, and it becomes clear — his height is perfectly ordinary; it's just that a step showed up in a couple of frames.
A typical medical neural network sees a patient as a point on a map: there's height, blood pressure, a blood test, and the model places a single label: "healthy" or "sick." But in a real hospital, the map is always torn. One test is done on Monday, another a month later, and the CT scanner is a different brand altogether. A point on such a map is self-deception.
When a neutron or proton enters an atomic nucleus, it behaves like a ball hitting a rough wall: it can bounce off in different ways, depending on where it hits.
Light born at the moment of the Big Bang has traveled to us for almost 14 billion years. But along the way, it passed through the gravitational fields of galaxies and clumps of dark matter, which bent its rays. To an observer, this looks like an image stretched and smudged by an old window pane.
An epidemic is not a steady stream but a series of hits. One carrier may infect no one, while another infects fifty people at once. Such rare but powerful events are called 'dragon kings': they stand out from the overall pattern and determine how severe a disease wave will be.
In the new study, the virus is compared to a billiard ball.
Inside a neutron star, matter is compressed to unimaginable densities. Previously, scientists speculated about its exact makeup, cycling through possible equations linking pressure and density. The new method tosses out guesswork: it directly ties the measurable mass and radius to the internal structure.
In February 2022, the eastern coast of Australia was hit by rains that lasted several days in a row. Water inundated towns in Queensland and New South Wales, insurers paid out 3.35 billion dollars, and the flood became the costliest in the country's history.
A rough sketch of a portrait: a few confident lines define the shape, but the details are not yet refined. That is how a parametric model, such as vector autoregression (VAR), describes a time series: it captures the main structure, but if the real data deviate from its assumptions, the portrait comes out distorted.
A meteorologist stares at a pressure map, trying to figure out where the cyclone will go. They have a model, but it is flawed, and fresh measurements, but they are incomplete. Merging the two so that the forecast remains physically meaningful is harder than it seems: classical methods sometimes produce negative temperatures or impossible probabilities.
A translator who jumps at every rustle in the hall starts mixing up words by the end of the meeting. Their confidence in being right grows, while their accuracy drops. That is roughly how poorly calibrated probabilistic forecasts behave: the model claims a high probability for an event, but reality disagrees.
An orchestra plays a complex piece, and each group of instruments enters on its own schedule. The violins might slow down while the woodwinds keep the same tempo, and the percussion might suddenly burst into a roll. The conductor hears everything at once, but pinpointing the exact moment when the flutes, not the cellos, changed rhythm is nearly impossible.