stat.ME stat.ME

31 articles

articles

stat.ME2012-04-022 minarXiv:1204.0286
Two Steps to a Sharper Forecast of Cloudbursts
On an old film strip of rainfall, only the brightest frames are visible, and between them lies noise. A meteorologist assessing flood risk long looked only at such frames, that is, at annual rainfall maxima. Everything else, thousands of daily observations, remained off-screen. The new method develops the entire film, and details that were previously invisible come into view.
Finding the Puppet Masters: How Causality Saves Predictions from Computational Blow-Up
The puppet master pulls the strings, and the marionette dances. In forecasting the future from time series, the puppet masters are the few variables that truly control the system. The rest merely echo their movements, creating an illusion of complexity. The challenge is to find these puppet masters and watch only their fingers, not the whole stage.
stat.ME2016-05-022 minarXiv:1605.00346
Where Ice Breaks: Finding Change Points in a Random Flow
The ice cover of a river looks solid, but beneath it lie cracks that alter the flow. So it is with a time series: behind the smooth surface of numbers hide moments when the rules of the game change. These moments are called change points, and finding them is like tapping the ice to locate weak spots.
stat.ME2016-12-193 minarXiv:1612.06303
The Ocean's Long Reach: Accounting for Teleconnections in Spatial Models
In the mountains of Colorado, snowfall varies from winter to winter, and the reason is not always local weather. Thousands of kilometers away, in the tropical Pacific Ocean, water warms and cools, and this pulsation extends an invisible hand that alters precipitation in the Rockies.
stat.ME2017-06-182 minarXiv:1706.05661
An Orchestra Where Every Instrument Enters on Its Own Schedule
An orchestra plays a complex piece, and each group of instruments enters on its own schedule. The violins might slow down while the woodwinds keep the same tempo, and the percussion might suddenly burst into a roll. The conductor hears everything at once, but pinpointing the exact moment when the flutes, not the cellos, changed rhythm is nearly impossible.
stat.ME2019-04-052 minarXiv:1904.02855
How to Make Your Model Pay for Its Mistakes
A translator who jumps at every rustle in the hall starts mixing up words by the end of the meeting. Their confidence in being right grows, while their accuracy drops. That is roughly how poorly calibrated probabilistic forecasts behave: the model claims a high probability for an event, but reality disagrees.
stat.ME2020-07-013 minarXiv:2007.00267
Causality That Flips Sign: How Regimes Shape Connections
In a tropical forest, the dry season gives way to the rainy season, and with the weather, the rules of life change: some animals go into hibernation, while others come out of hiding. Likewise, in complex systems, from climate to economics, the links between processes are not set in stone. They depend on a hidden "regime" that itself switches from time to time.
stat.ME2020-10-053 minarXiv:2010.02247
A Causal Map Without Intervention
An orchestra without a conductor plays in harmony, and you want to understand who influences whom. The violinist hears the cello, the cellist catches the rhythm of the percussion, and the flute adapts to everyone at once.
stat.ME2021-12-093 minarXiv:2112.04843
The Uneven Pulse of Time: How Irregular Measurement Rhythms Skew Conclusions and What to Do About It
Imagine an interpreter who gets distracted by every rustle in the hall. The more rustles, the more errors in the translation, even though the meaning of the speech hasn't changed. The same happens with data: if measurements are unevenly spaced, standard analytical tools start "hearing" changes that never occurred in the underlying process.
How El Niño Stretches Thunderstorm Fronts
A thunderstorm front is like a rubber band stretched between two fingers. The harder you pull, the wider the strip where lightning strikes. Meteorologists have long been able to measure storm intensity at a single point, but until now they didn't understand why severe weather sometimes compresses into a compact blob and sometimes covers half a continent.
stat.ME2022-05-192 minarXiv:2205.09252
Breaking Point in the Flow of Functions
A seismograph records underground tremors: the smooth line suddenly jerks and changes its character. Similarly, functional data, such as ocean temperature maps or brain signals, may shift their shape at some point. The new algorithm FSBS catches such breakpoints, even when each curve is measured at only one point and noise drowns the signal.
stat.ME2023-06-082 minarXiv:2306.04966
Hybrid Spectral Analysis: How a Bayesian Method Combines the Precision of Parametrics with the Flexibility of Nonparametrics
A rough sketch of a portrait: a few confident lines define the shape, but the details are not yet refined. That is how a parametric model, such as vector autoregression (VAR), describes a time series: it captures the main structure, but if the real data deviate from its assumptions, the portrait comes out distorted.
stat.ME2023-11-193 minarXiv:2311.11445
Hidden Ocean Regimes: How to Catch Non-Integer Delays
The ocean doesn't always stick to the same schedule. Sometimes the warm El Niño current strengthens, sometimes it weakens, and each regime dictates its own reaction speed to the past. These hidden regimes are like shifts in currents that remember their path with different depths.
Disentangling Complexity: How to Tell a Direct Signal from a Chorus of Voices
An orchestra without a conductor plays a complex piece. The listener hears the overall music but wants to understand who leads the melody and who merely echoes it in unison.
stat.ME2025-06-022 minarXiv:2506.01658
Compressing an Ocean into a Few Hundred Numbers: How a New Model Predicts El Niño
Climate scientists have long debated where exactly the El Niño "pool" is located: the region in the equatorial Pacific that first responds to an impending weather shift. The debate isn't due to a lack of data. The ocean is measured along longitude, latitude, and depth, and each slice contains thousands of numbers. The problem is that there are too many numbers to see the pattern directly.
Climate as Conductor: Neural Network Learns to Direct Extremes
An orchestra of a thousand musicians plays in harmony as long as the conductor keeps the tempo. But the moment he changes the score, the violins in one corner start playing louder, while the brass in another come in late.
q-bio.GN2026-01-142 minarXiv:2601.09758express
How to Tell a Technical Glitch from a Real Disease
Genetic diagnostics is like comparing two photos taken with different cameras. If one camera slightly shifts the colors, the image will show "defects" that don't exist in reality.
stat.ME2026-01-302 minarXiv:2601.22481
Breaking Points: How a Restorer Cleans Data
Old weather records hold surprises: the thermometer suddenly jumps by half a degree, not because of the weather, but because the station switched instruments. Such abrupt shifts in data are called changepoints, and separating them from genuine climate signals is a challenge statisticians grapple with.
Image Processing2026-02-121 minarXiv:2602.11873express
How to Assemble an Aorta from Six Scans
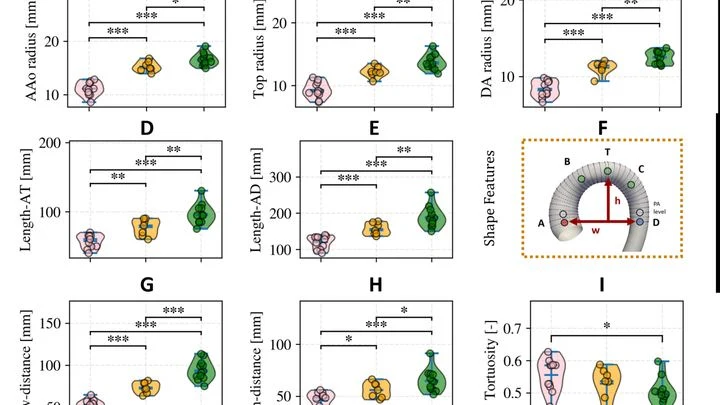
The body's main artery, the aorta, is not just a tube. With each heartbeat, it stretches and contracts like a rubber hose under water pressure. Seeing this motion in volume is hard: standard MRI gives only flat slices, and full 3D imaging over time requires expensive equipment and long periods lying in the scanner. A group of researchers found a way out.
Materials2026-02-191 minarXiv:2602.17225express
A Furnace for Material Maps
On a silicon wafer the size of a dinner plate, you can place not just one substance but an entire map of thousands of different compositions. A laser knocks atoms off targets and deposits them in thin layers, varying the proportions from point to point. The result is a materials library: more of one metal here, more of another there, and all combinations visible at once.
stat.ME2026-02-191 minarXiv:2602.17772express
The Brain Prints Itself: How Electrode Pairs Speed Up Mind Reading
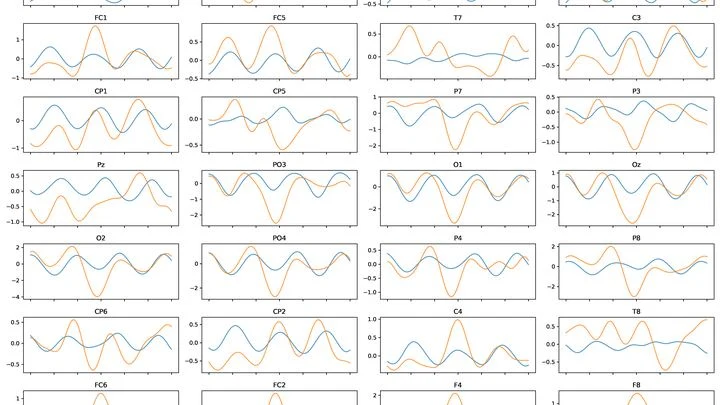
A person looks at a screen where letters flash. They don't move a hand or an eye: they only mentally note the desired symbol. Sensors on the head pick up the brain's faint electrical waves, and the computer figures out which letter the person chose. That's how a brain–computer interface works: it gives a voice to those who can't speak or move.
q-bio.QM2026-02-221 minarXiv:2602.19295express
Two Mutant Brothers: Why One Gene Change Can Alter Lung Cancer's Fate
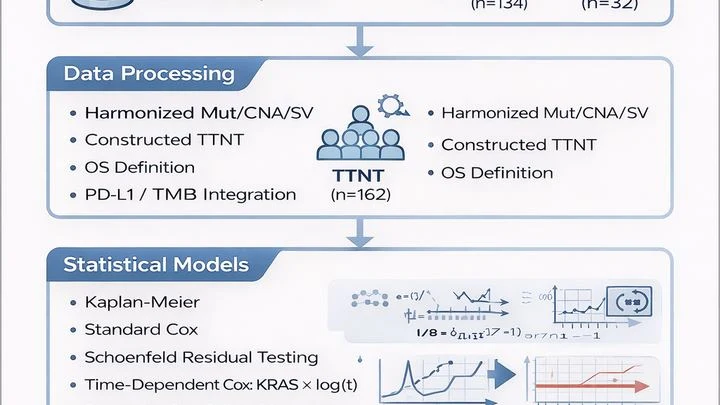
Cancer cells are like broken cars: one glitch makes them drive without stopping. In the KRAS gene, such glitches happen most often. But glitches come in different flavors: the wrong amino acid can sit in one spot of the protein, and that determines how the tumor behaves. In the new study, two such glitches were compared: G12C and G12D.
Applied Statistics2026-03-031 minarXiv:2603.02616express
How to Peek Inside the Heart Without a Pricey Ultrasound
An electrocardiogram is like a recording of an engine's hum: an experienced mechanic can hear when something's off. A heart ultrasound shows the engine itself from the inside, but the machine is pricey and specialists are scarce.
stat.ME2026-04-251 minarXiv:2604.23463express
How Two Doctors Together Make a More Accurate Diagnosis
Two specialists look at the same breast image. One is an experienced doctor, the other is an artificial intelligence program. Sometimes their opinions match, sometimes they diverge. How often they agree determines how accurately they can together distinguish healthy tissue from a tumor.
stat.ME2026-05-182 minarXiv:2605.18655express
A Dark Matter Map Without a Safety Net
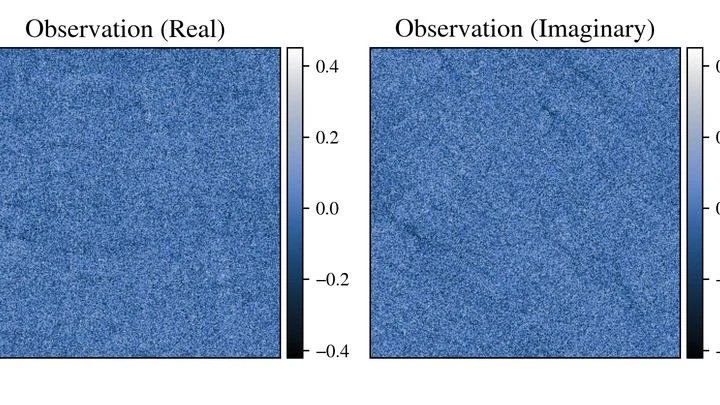
A camera takes a snapshot, but the sensor is noisy, the optics blur, and some pixels are overexposed. Reconstructing the original picture is like guessing a melody from a scratched record: there are many possibilities, and which one is true is unclear.
q-bio.QM2026-06-102 minarXiv:2606.11876express
When a Test's Silence Speaks Louder Than Numbers
When the canary in the coal mine falls silent, the miners know: the gas is already here, time to get out. Tumor DNA floating in the blood behaves much the same way. The drug bears down on the cancer, and the level of this DNA drops to nearly zero. The test stops seeing it. The doctor sees 'clean' and breathes easy. But silence can be deceptive.
How to Assemble a Brain Connectivity Map from Scattered Fragments
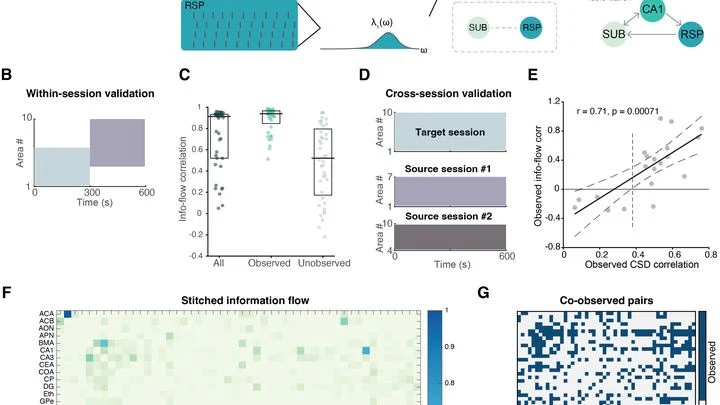
A patchwork quilt where each patch is a recording of activity from a small brain region. One patch was stitched on Monday in London, another on Tuesday in New York, and a third a month ago in Tokyo. This mosaic covers the brain only partially, and there is no common seam to join them.
stat.ME2026-06-242 minarXiv:2606.26061express
A New Way to See the Hidden in Data Chaos
A lab robot counts molecules, and gets it wrong. One tube shows 0, another 12, a third 3, though in reality they all hold roughly the same amount. Such 'raw' numbers are common in biology: DNA sequencing, counting species in a water sample, gene activity. There's plenty of data, but it's sparse and more scattered than simple randomness would predict.
Squealer: When the Model Squeals, Rejecting Your Data
Statistical models are an attempt to stretch a perfect mathematical web over the uneven landscape of data. When a model resists, it emits tension, but we've grown accustomed to ignoring it. Researchers spend hours staring at residual plots, trying to guess where the model is 'coming apart at the seams.' Squealer translates this resistance into sound.
q-bio.CB2026-08-011 minarXiv:2608.00846express
How a Cell Chooses Its Path: A View Through the Noise
A Dictyostelium amoeba crawls across glass. Its path is recorded — a chain of points on a plane. But what forces are pushing it? Inside the cell, a molecular motor works: proteins pull, the membrane springs, water presses.
Statistical ML2026-08-171 minarXiv:2608.16506express
How to See Shape When Data Are Unevenly Sampled
Two photographers shoot the same mountain. One takes a hundred shots from the summit and only a couple from the base; the other does the opposite. If you try to align their images, the algorithm might decide that the summit in one photo matches the summit in the other simply because there are many similar points there, not because it's the same spot. Sampling density throws it off.