Nonlinear Laplacian spectral analysis (NLSA) is a computational technique for finding patterns in complex, time-varying data — such as climate records, ocean currents, or fluid flows — without assuming the system behaves linearly. Traditional methods like Fourier analysis or principal component analysis assume that the underlying dynamics are linear and stationary, but many natural systems are not. NLSA instead uses ideas from geometry and spectral theory to extract modes that capture the system's intrinsic, often nonlinear, behavior.
History
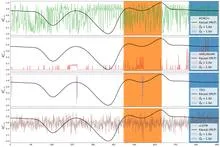
NLSA was introduced around 2010 by Dimitrios Giannakis and Andrew J. Majda, who applied it to climate data to extract modes of variability such as the Madden–Julian oscillation.
How it works
The method builds a graph from the data points, where each point represents a state of the system at a given time. Points that are close in state space are connected, and the graph's Laplacian — a matrix that encodes local connectivity — is computed. By analyzing the eigenvectors of this Laplacian, NLSA identifies smooth, slowly varying patterns that correspond to the system's dominant dynamical modes. Crucially, it does this without first filtering the data, so it can separate meaningful signals from noise and capture intermittent or anharmonic oscillations that linear methods miss.
In practice
NLSA is used in climate science to identify and track modes of variability in large datasets, such as sea-surface temperature or wind fields, and it has also been applied to problems in fluid dynamics and neuroscience.
Fun fact
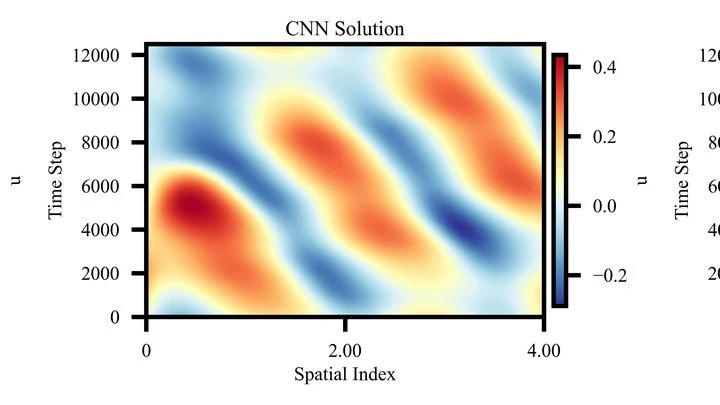
NLSA can detect patterns that repeat irregularly in time, like the Madden–Julian oscillation, which standard Fourier analysis would smear into a broad, indistinct peak.
An orchestra without a conductor: each musician tunes to a neighbor, and out of that comes a well-coordinated melody. In the world of microscopic magnets, the role of that orchestra is played by a tiny neodymium sphere levitating above a superconducting film.
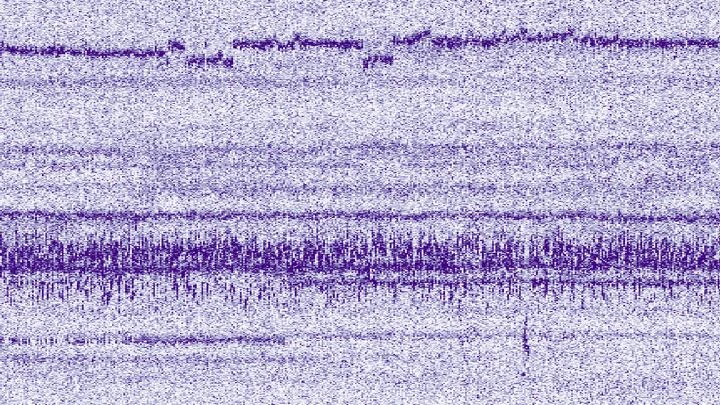
The orchestra plays without a conductor. Each instrument follows its own schedule: the violin on Monday, the flute on Wednesday, the timpani on Saturday. Astronomers hear not music but isolated notes scattered across the calendar. A telescope sees a star only when it is above the horizon and when the schedule has allotted time for it.
Somewhere in the depths of the Milky Way, radio pulses flare up from time to time — rare, steady, like the ticks of a distant metronome. These long-period radio transients were discovered only recently, and they immediately puzzled astronomers.
A superconducting qubit is like a finicky musical instrument: until you tune it, you won't get a clean note. But even after tuning, the pitch drifts. The culprits are tiny defects in the material that physicists call two-level systems. They're like invisible cracks that appear and disappear, throwing off the processor's rhythm.
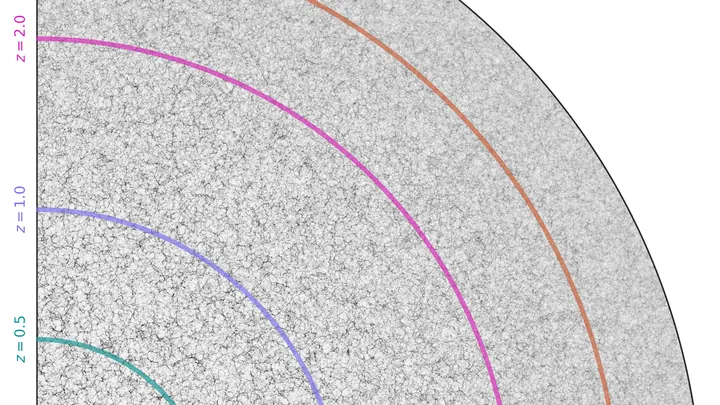
In a dark room, music plays. Powder is scattered on the floor — fine, almost invisible. Low frequencies make it gather into intricate patterns: filaments, clumps, voids. In much the same way, gravity over billions of years weaves galaxies into the cosmic web — except here, attraction does the work instead of sound waves.
A basin of wet sand. You press in one corner, and water starts moving. But how exactly? Instead of an even circle, it might spread in tongues, linger in some spots, and rush through others. Underground, the same thing happens: oil, water, or gas migrate through rocks not by the textbook, but following the chaos of fractures and heterogeneities.
Communicating with a satellite is like trying to hear a whisper in a storm: the signal drowns in noise. Engineers have created an AI algorithm that runs directly on the satellite and, with minimal power consumption, detects distortions more accurately than previous methods.
In a soup pot, you only need two thermometers to gauge the temperature everywhere — if you know heat travels in circles from the bottom. Science works the same way: from a handful of measurements, you want to reconstruct the full heat picture.
The system captures the gist of heat flow, compressing it into a handful of governing numbers.
In a noisy room, a person picks out a desired voice thanks to two ears capturing the difference in sound arrival. A computer with several microphones does the same: it gets spatial cues — where each voice is coming from.
Previously, these cues were used to focus on one direction, like a flashlight beam.
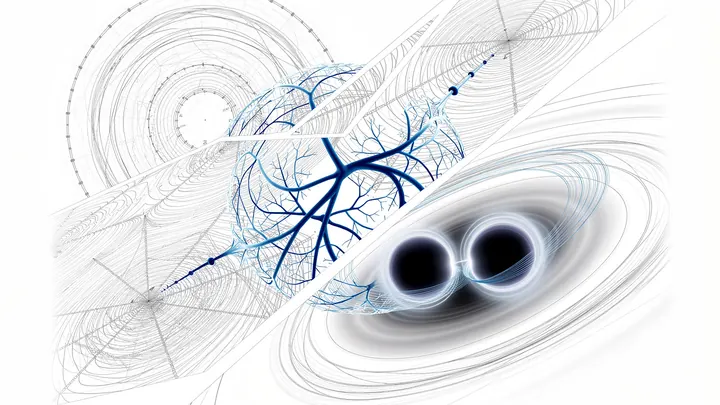
Isolating the signal from a single pair of supermassive black holes is like hearing a dancer's footsteps amid the roar of a hurricane. Somewhere in space, these monsters spin in a slow gravitational tango, distorting spacetime itself.
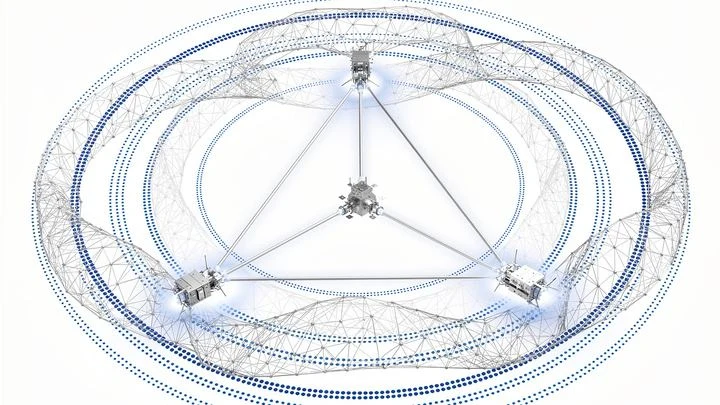
The Universe is not silent: it is filled with a continuous gravitational-wave hum. In a decade, the LISA space observatory will tune its "ears" to the millihertz range, and the richest source will be our Galaxy — tens of thousands of white dwarf pairs whirling in a frantic dance.
A handful of sand falls onto a table: each grain rolls down until it rests in a hollow. That's how a potential works: the table's surface tells the grains where to go. But in a river with whirlpools, there's no single basin everything flows into. Water swirls, returns, and meanders. For such systems, the usual map of 'pits and hills' doesn't apply.
A translator records a multi-hour conversation. If they try to hold the entire dialogue in their head, they're bound to garble details by the end. That's roughly how gravitational observatories work: they listen to the 'conversation' of massive bodies spiraling together.
An orchestra plays without a conductor, and you hear the tempo speeding up and slowing down. All you have is a recording of the sound, not the score. Can you tell from that recording which string to pluck to make the whole orchestra play more steadily?
A candle flame in a draft dances: now it flares up, now it almost goes out. Quasars behave much the same way — supermassive black holes in the centers of distant galaxies, surrounded by a scorching disk of infalling matter. Only they flicker not over seconds, but over months and years.
Astronomers listen to the cosmos like an old radio: they twist the knob not to find a particular station, but to catch any unusual noise. This approach breaks the mold: instead of hunting for gravitational waves using memorized patterns, they catch everything — without bias.
The universe sometimes resembles a pot of boiling water. With enough heat, liquid turns to vapor: that's a phase transition. Something similar could have happened in the early universe: a field filling space suddenly changed its state, like water becoming gas.
In a hall with a hundred instruments, a symphony is playing, but the conductor is hidden behind a screen. The scientist hears only the notes played by the instruments and wants to understand who sets the rhythm. Scientific data resembles such an orchestra: we record instrument readings but do not see the hidden mechanisms that drive them.
A drop of ink in a glass of water spreads evenly, but in a cup with chunks of fruit jelly, the ink will take winding paths — sometimes getting stuck, sometimes slipping through. Similarly, molecules in living cells or porous materials don't move on a smooth field but through a disordered medium: denser in some places, thinner in others.
The lungs are not two bags but millions of tiny sacs where air enters and blood flows close by. To see how they work, doctors sometimes use MRI without contrast: the scanner picks up weak signals from the tissues themselves. But these signals are like a radio in a thunderstorm — breathing is irregular, pulse jumps, and the image falls apart.
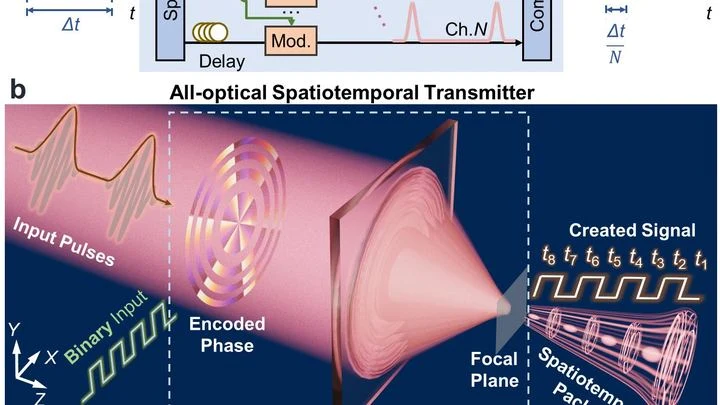
Light can carry information faster than any electronics. But usually, between a computer and a laser sits a digital-to-analog converter — a device that turns zeros and ones into electrical signals. It's the bottleneck.
The new transmitter does away with this middleman.
A tiny diamond bridge vibrates so strongly that it starts to 'sing' at many frequencies at once. Previously, such vibrations would dampen themselves: the harder the resonator swung, the harder it was to add energy. Physicists found a loophole in this rule.
They used light to drive the diamond. Light pushes on the bridge, making it tremble.
According to Einstein's theory, massive objects cause spacetime curvature, like a heavy ball warping a rubber sheet. As they accelerate, they create ripples — gravitational waves, akin to the circles from a stone dropped in a pond.
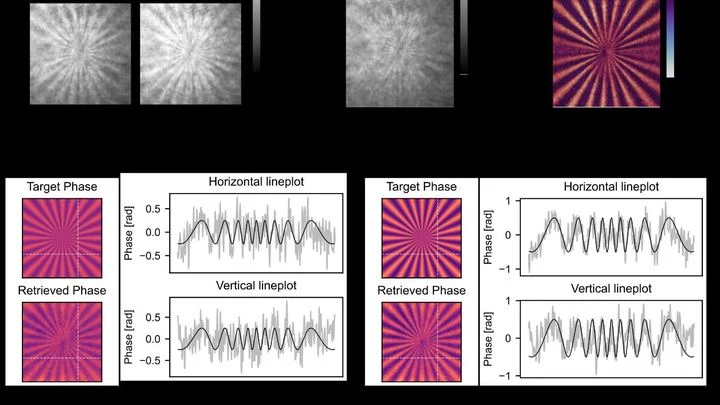
A glass marble in a glass of water is nearly invisible, but if you look through it at a checkered tablecloth, the lines behind it appear distorted. Transparent cells behave the same way: light passes through them but is slightly slowed and changes direction.
Cosmic rays are charged particles that constantly bombard Earth from deep space. When one of these particles enters the atmosphere, it collides with air nuclei and spawns a whole cascade of secondary particles: electrons, muons, photons.
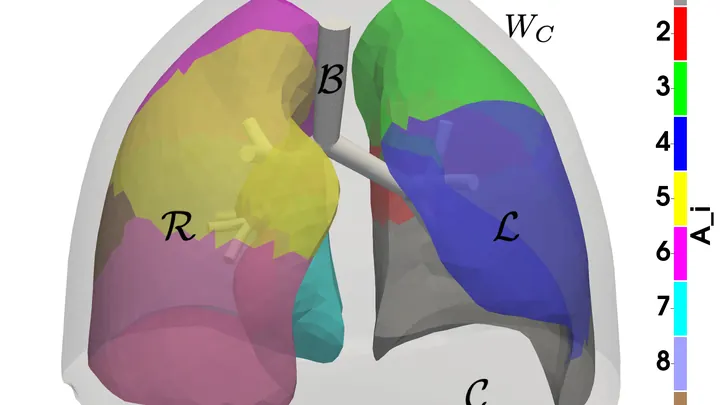
A lung scan reveals a tree: the trunk is the trachea, branches are the bronchi, and leaves are the alveoli. But how does air spread through these branches? Scientists built a computer model that replicates the lung's shape from images obtained via computed tomography.
The bronze plates of a gamelan do not sound according to a single tuning standard: each orchestra on Java keeps its own tuning, and two neighboring ensembles may play the same melody in slightly different intervals.
Old weather records hold surprises: the thermometer suddenly jumps by half a degree, not because of the weather, but because the station switched instruments. Such abrupt shifts in data are called changepoints, and separating them from genuine climate signals is a challenge statisticians grapple with.
Toss a handful of pebbles into a stream: some settle on the bottom, others get swept around. That's roughly how waves behave in a disordered medium — light in frosted glass, sound in porous material. Usually, disorder slows things down: the wave gets stuck, spreads out, loses direction. But in a new study, physicists built an acoustic lattice where things work differently.
Water in a stream bends around rocks, but the math of that motion hides in a black box: that's how ordinary neural networks work. They give an answer but don't say why. Engineers can't trust a prediction if they can't see its reasoning.
Fluid dynamics now has a transparent model.
Open systems exchange energy with their surroundings, like a guitar string fading into the air. Scientists built such a system out of light, twisting the beams into corkscrews and forming an artificial lattice — a maze where losses can be controlled at every step. Light in this maze always moves at the maximum possible speed, but its energy can fade or grow.
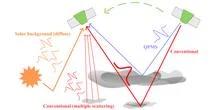
Ice clouds can masquerade as water clouds. A satellite lidar sends a short laser pulse downward and catches the reflection. If flat ice plates hang horizontally in the cloud, they act like tiny mirrors: light bounces back almost without loss. To the instrument, such a flash looks just like a reflection from water droplets.
Imagine a translator in a noisy hall, trying to catch a speech through the buzz of voices. The usual approach is to memorize a set of phrases and slot them into templates. But when the noise cranks up, the template falls apart.
Picture a translator at a meeting where everyone speaks an unfamiliar language. They don't know the words, but they notice: when one person raises their voice, another starts nodding a minute later. At first it seems like coincidence, but over time the translator learns to understand who influences whom.
Glasses with flat lenses show a symmetric world: rise and fall, heat and cold look the same. For decades, climatologists have viewed El Niño through such glasses, using linear inverse models. These captured the rhythm of oscillations but missed that the warm phase of El Niño is typically sharper and stronger than the cold La Niña.
An interpreter at negotiations hears only the words already spoken, yet still guesses the next phrase. This is how the new El Niño forecasting method works: it doesn't peek into the future but relies solely on the past, like an honest listener.
An interpreter at a conference hears the noise of the hall but keeps translating. They don't repeat every word; instead, they find an intermediate language where complex phrases become simple, yet meaning is preserved.
Ocean currents intertwine like sticky spider silk: every disturbance leaves a trace that does not vanish instantly. Climatologists have been used to treating random jolts in this web as invisible and memoryless, but new research shows that noise has memory, and that memory strengthens connections between distant nodes.
Every winter, the Pacific Ocean warms slightly off the coast of Peru, and every summer it cools. This rhythm is set by the gears of the climate machine, but some turn fast, others slow, and still others speed up or stall. Linear inverse models have helped us glimpse these gears in data for decades, but they were blind to seasonal changes in pace.
A translator in a conference room hears not only the words but also the echo of previous phrases still bouncing around the ceiling. If they get distracted by every reverberation, an hour of conversation turns into two. Similarly, a complex system, whether an ocean or a power grid, receives random jolts that do not vanish instantly but drag behind them a tail of memory.