Погода против климата: как отличить шум от сигнала экспресс
Зимой в одном районе города выпадает втрое больше снега, чем в соседнем. Один год — жара, другой — холод. Это капризы погоды. А за десятилетия виден другой, медленный сдвиг: зимы в среднем становятся мягче. Отличить одно от другого — главная задача климатологов.
В новом исследовании предлагают считать, сколько в данных о температуре или осадках случайных колебаний, а сколько — устойчивого изменения. Используют компьютерные модели, которые прогоняют много раз с чуть разными начальными условиями — так получают целый веер возможных вариантов климата. Затем сравнивают разброс между этими вариантами и сдвиг, вызванный внешним воздействием, например, ростом углекислого газа.
Оказалось, что новый способ работает надёжнее прежних, даже если данные сильно «разбросаны» или содержат редкие экстремальные значения. Главное — чтобы в ансамбле было не меньше сорока вариантов расчёта. Когда воздействие усиливается, доля случайности снижается, и это видно особенно чётко.
Такой инструмент помогает отделять зёрна от плевел: понимать, что в климатических прогнозах действительно вызвано деятельностью человека, а что — просто естественная изменчивость, как неожиданный снегопад в мае.
Оригинальная аннотация
как её написали авторы, на английском arXiv:2608.14455v1
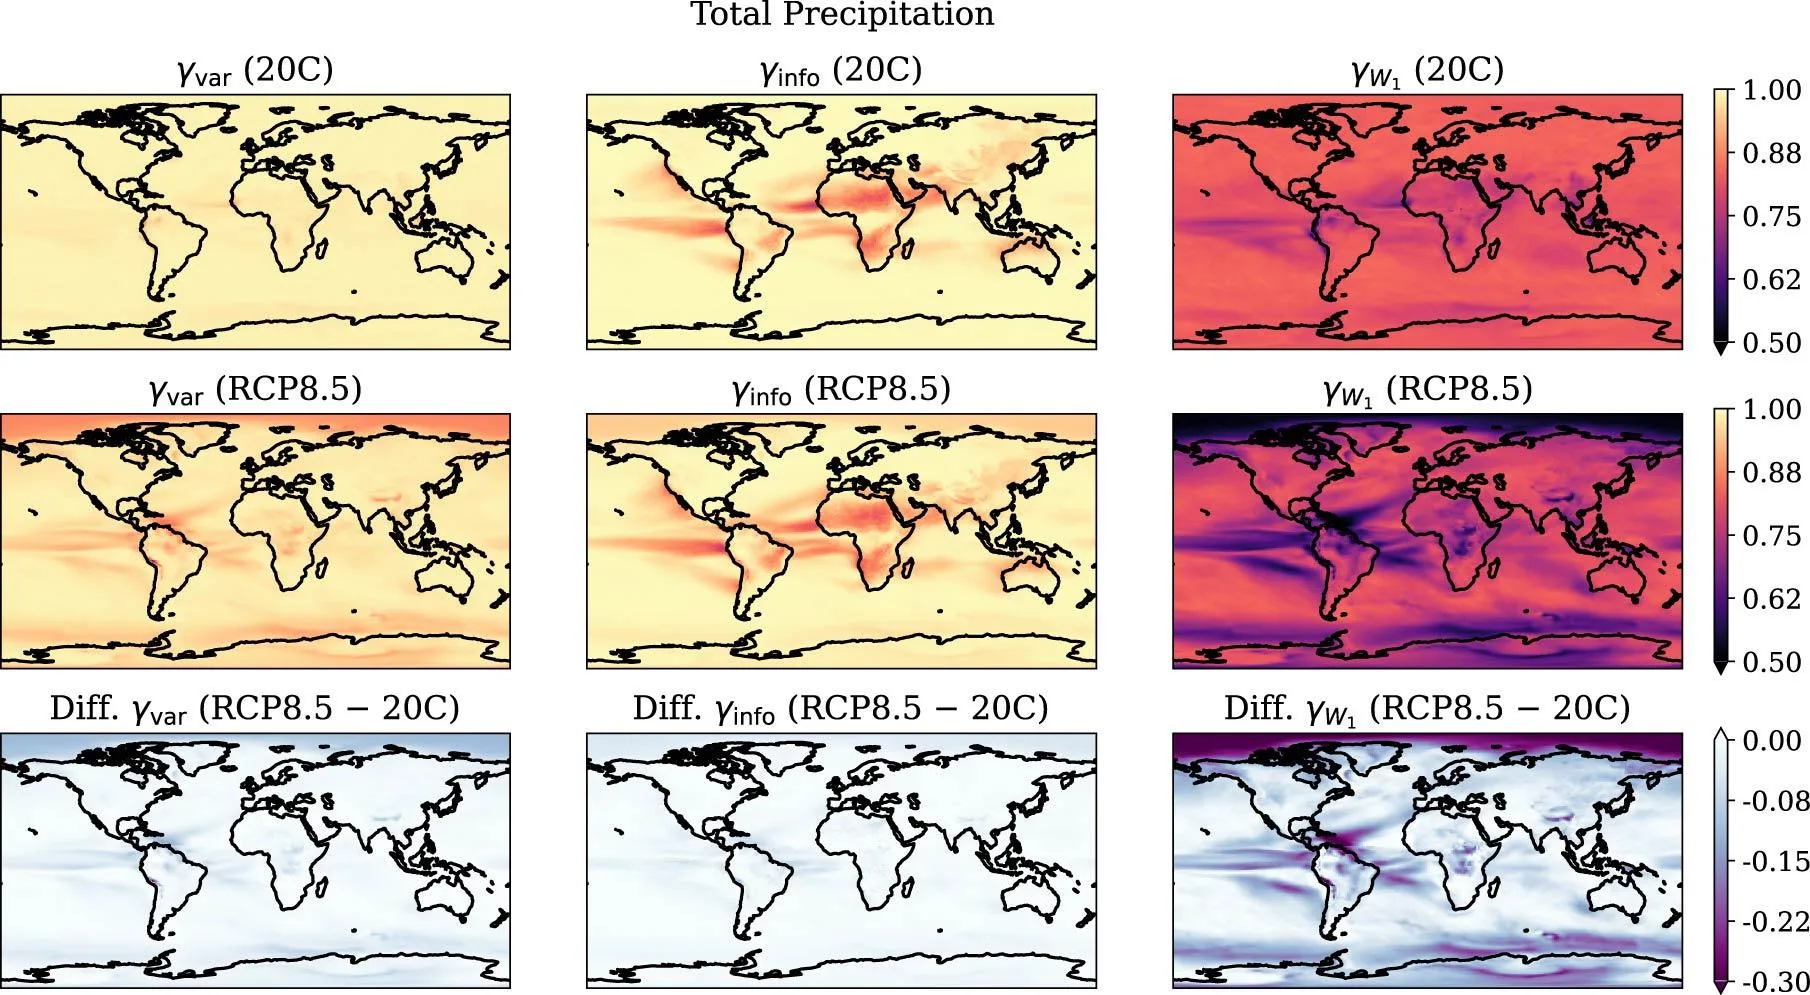
Quantifying forced and internal variability in climate data is fundamental to detecting the climate change signal and assessing uncertainty in climate projections. We propose a metric that quantifies the relative magnitude of internal variability in single-model initial-condition large ensembles (SMILEs). We measure forced and internal variability by two 1-Wasserstein distances, a form of optimal transport cost. The proposed metric is the distance for internal variability divided by the sum of the two. Computing this ratio requires only sorting the samples and differencing the resulting quantiles, with no additional parameters. The metric reflects the entire distribution shape and applies to non-Gaussian variables, because the 1-Wasserstein distance quantifies the difference between any two probability distributions. We validate the metric with synthetic climate data from Gaussian, uniform, and lognormal distributions. Unlike the two existing metrics, the proposed metric gives stable estimates irrespective of the distribution shape and the presence of outliers, provided that the ensemble has about 40 members or more. We then apply the proposed and existing metrics to the 2 m air temperature and total precipitation of the Community Earth System Model Large Ensemble (CESM-LE) under two different forcing scenarios. All the metrics indicate that the relative contribution of internal variability decreases as the forcing increases, but the proposed metric shows this response most clearly. The 1-Wasserstein distance thus provides a simple and useful tool for analyzing large-ensemble datasets.
В одном из сценариев моделирования потепление оказалось настолько сильным, что случайные колебания температуры почти перестали влиять на общую картину — сигнал изменения климата стал очевидным.