Why Thunderstorms Travel in Packs
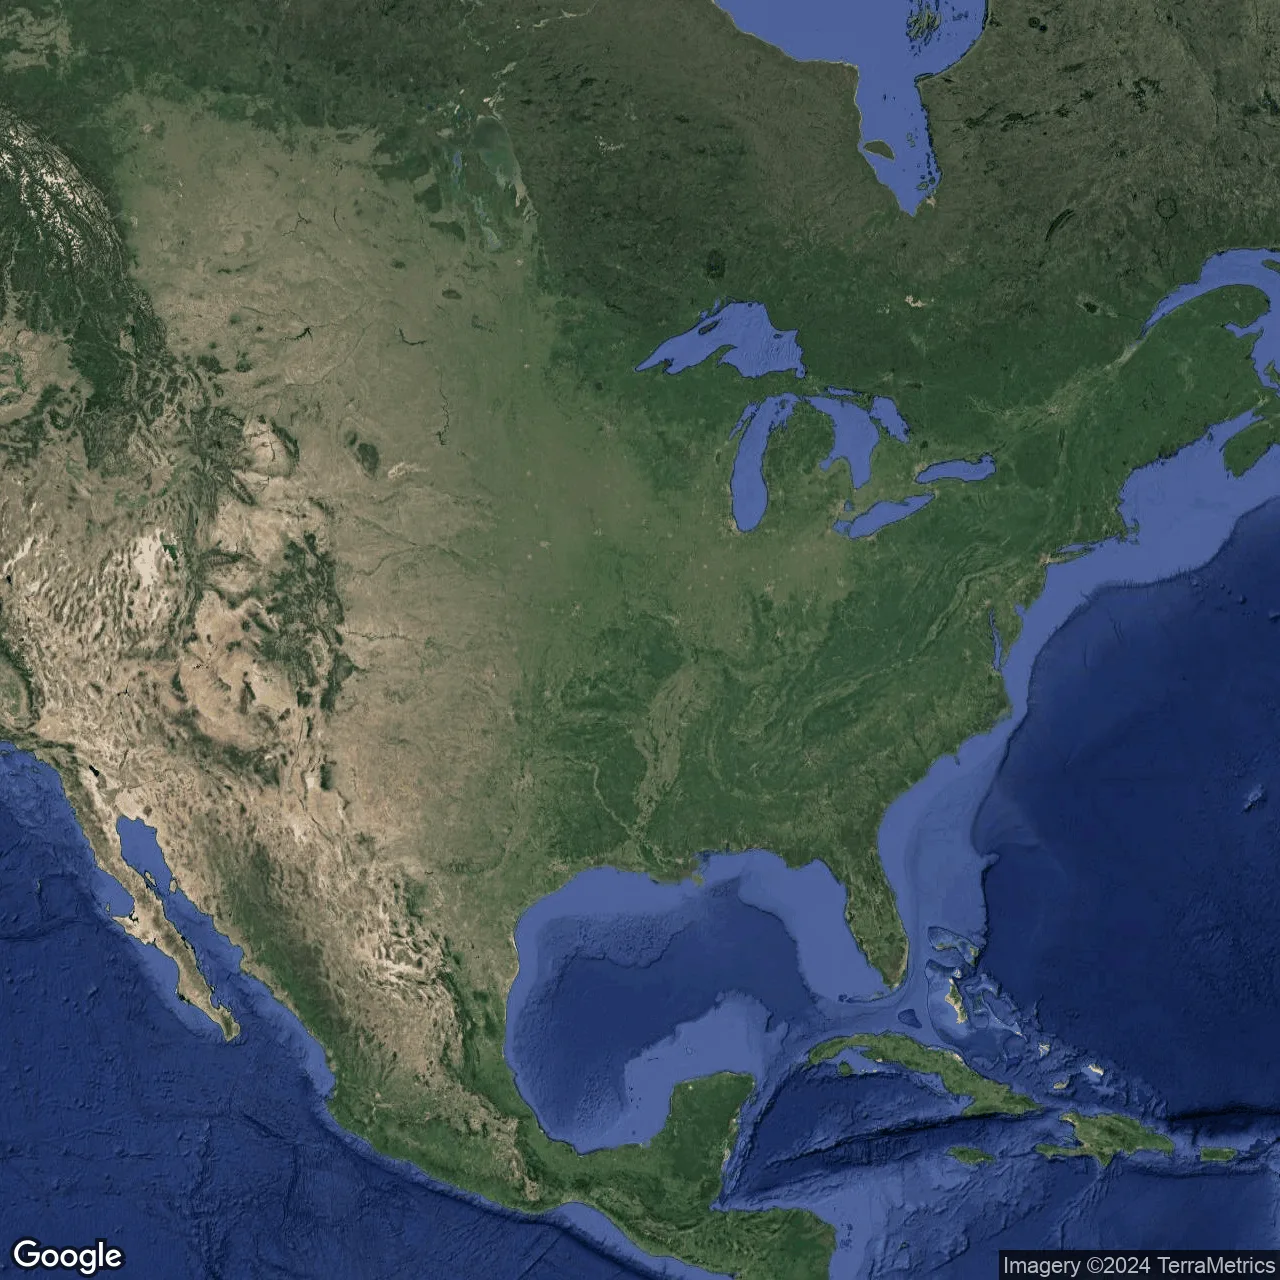
A thunderstorm front is like a rubber band. If you leave the band alone, it lies bunched up, and storms form in isolated spots. If you stretch the band, the band of bad weather widens and covers several states at once. Scientists wanted to understand what exactly stretches this band in the atmosphere.
They collected data on stormy weather in the U.S. over 37 years. For each month, they picked the strongest values of three indicators: how much heat and moisture the air holds, how strongly the wind spins up a storm, and an overall measure of their combined effect. Then they built a model that shows at what distance thunderstorm centers are still linked to each other. They called this distance the range.
It turned out that the warm El Niño current in the Pacific Ocean stretches the band even more. In northern states, the range increases by 20–30%, and in the northeast, for the overall indicator, it can grow by almost a factor of two. Previously, it was thought that the connection between storms in different places was always the same. Now it is clear that it changes with the seasons and depends on ocean currents. This knowledge helps us prepare in advance for the possibility that one storm will cover an entire region rather than a single city.
The range parameter for PROD in the northeastern US during a strong El Niño can increase by nearly a factor of two compared to the neutral phase, meaning that thunderstorm systems can cover an area comparable to several states.
In Kim Stanley Robinson's novel 'Forty Signs of Rain', climate models predict extreme weather events, and the accuracy of such predictions depends on accounting for global oscillations like El Niño.