How El Niño Stretches Thunderstorm Fronts
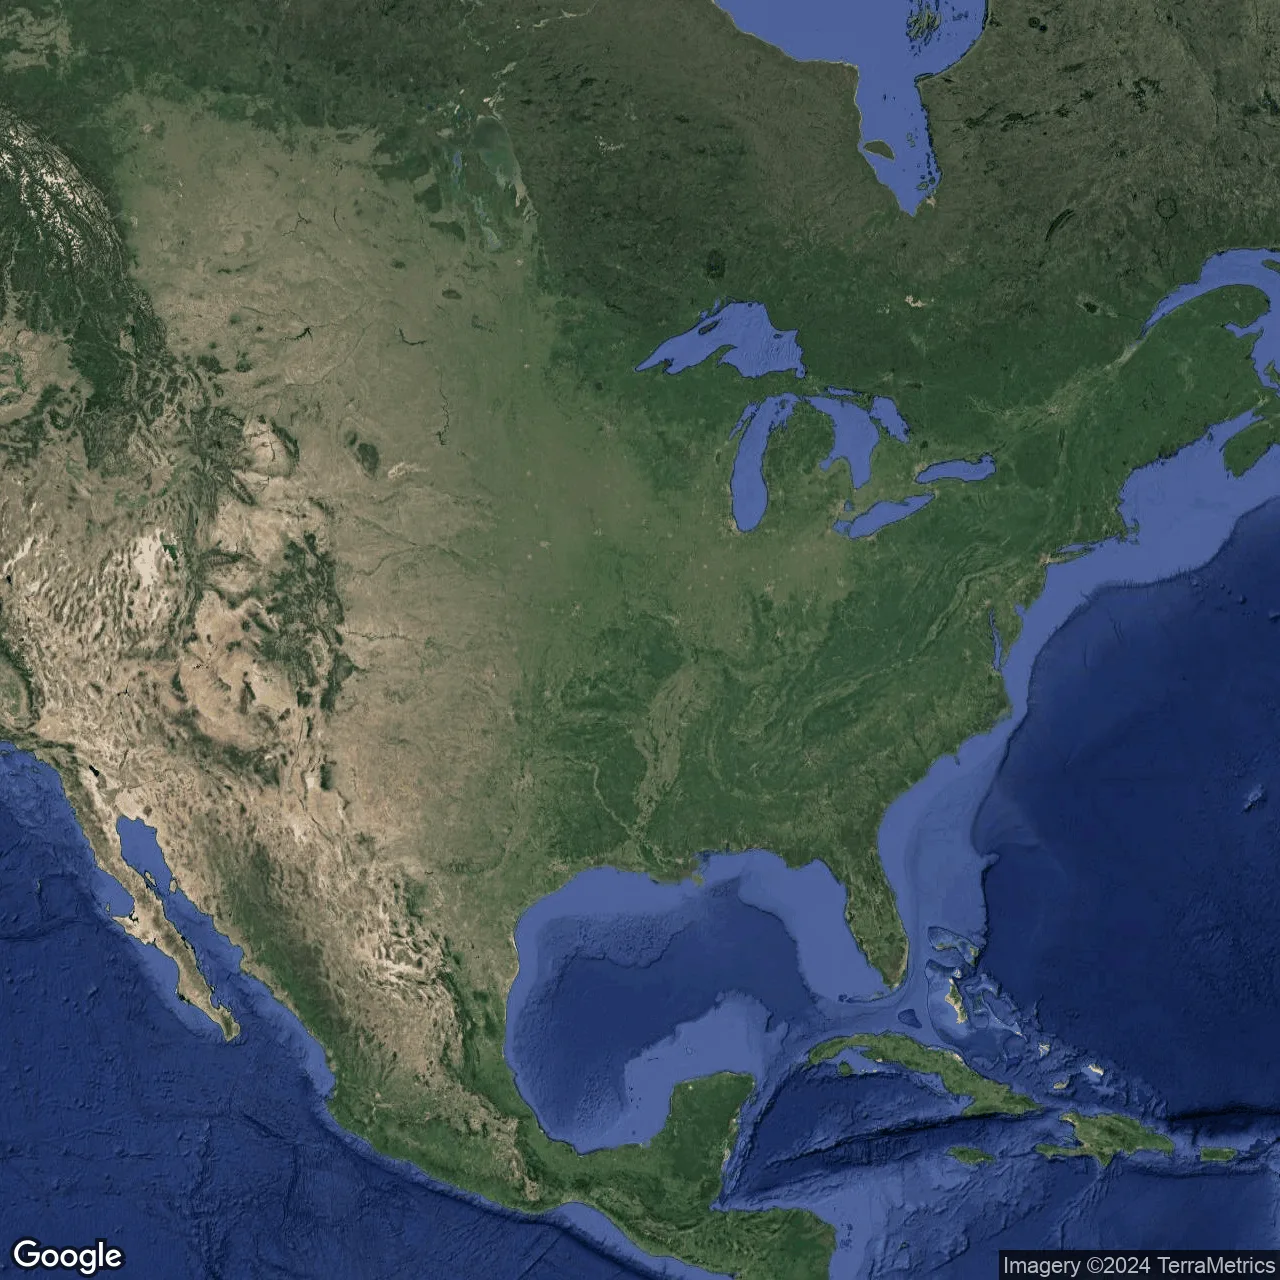
A thunderstorm front is like a rubber band stretched between two fingers. The harder you pull, the wider the strip where lightning strikes. Meteorologists have long been able to measure storm intensity at a single point, but until now they didn't understand why severe weather sometimes compresses into a compact blob and sometimes covers half a continent.
In the new study, scientists took data on three thunderstorm environment indicators over 37 years: CAPE (convective available potential energy, the reservoir of heat and moisture that lifts air upward), SRH (storm-relative helicity, the ability of wind to spin updrafts), and their product PROD. For each grid point over the US, they selected monthly maxima and built a model describing how extreme values at different locations are related.
It turns out that in summer the band contracts: extremes become more localized in all regions. In winter and spring it stretches. But the most interesting part happens when El Niño warms up in the Pacific. Then, in northern states, the range for SRH grows by 20–30%, and for PROD in the northeast it can increase by nearly twofold. This means the same type of thunderstorm weather covers a much larger area.
Previously, risk specialists assumed that the spatial connectivity of extremes was constant. Now it's clear that it breathes: contracting in summer, stretching in winter, and additionally deforming under the influence of ocean currents. This approach can be applied to floods, wildfires, or financial crises—anywhere rare events at different points are linked by invisible threads.
If you know the El Niño phase in advance, insurance companies and emergency services can prepare for a severe storm covering not just one county but an entire region. The rubber band of weather is no longer a mystery, and now its tension can be measured.
The range parameter for PROD in the northeastern US during a strong El Niño can increase by nearly a factor of two compared to the neutral phase, meaning that thunderstorm systems can cover an area comparable to several states.
In Kim Stanley Robinson's novel 'Forty Signs of Rain', climate models predict extreme weather events, and the accuracy of such predictions depends on accounting for global oscillations like El Niño.