An El Niño index is a single number that summarizes the state of the El Niño–Southern Oscillation (ENSO) in the tropical Pacific. Because ENSO involves both ocean temperature and atmospheric pressure, no single measurement captures it fully. Indices distill complex observations into a trackable metric, allowing scientists and forecasters to classify conditions as El Niño, La Niña, or neutral. The most common indices use sea-surface temperature anomalies in specific regions, while others combine pressure differences across the Pacific.
History
The first quantitative index was the Southern Oscillation Index, developed by Sir Gilbert Walker in the 1920s to track the pressure seesaw he discovered. Sea-surface temperature indices came later, in the 1980s, as satellite and buoy data became available.
How it works
The simplest index, such as the Niño 3.4 index, averages sea-surface temperature anomalies over a box in the central-eastern equatorial Pacific (e.g., 5°N–5°S, 170°W–120°W). When this average exceeds +0.5°C for several months, an El Niño is declared; below −0.5°C indicates La Niña. The Southern Oscillation Index (SOI) instead measures the normalized pressure difference between Tahiti and Darwin, Australia—negative during El Niño. More sophisticated indices combine multiple variables, but all serve the same purpose: reducing a complex phenomenon to a threshold-based classification.
In practice
Used by meteorological agencies worldwide to issue El Niño advisories, which trigger preparedness for floods, droughts, and altered hurricane seasons.
Fun fact
The threshold of +0.5°C for El Niño is arbitrary—chosen for practical forecasting—but small shifts in this value can change whether a borderline year is labeled an event, affecting billions in disaster planning.
The merger of two neutron stars is not just a collision. Even before they touch, they deform each other through tidal forces, and this deformation depends on how 'soft' or 'stiff' the matter inside is. Stiff matter resists more; soft matter changes shape more easily.
A student who has spent years solving problems from other people's textbooks suddenly receives three notebooks with real ocean observations. There are few problems, but they have already seen hundreds of similar ones, and now a couple of examples suffice to catch the new teacher's style.
Every winter, the tropical Pacific Ocean seems to replay the same script: sea surface temperatures off the coast of Peru rise, trade winds weaken, and a wave of droughts and floods spreads across the planet. This is El Niño, and its peak almost always falls in December. Why winter in particular?
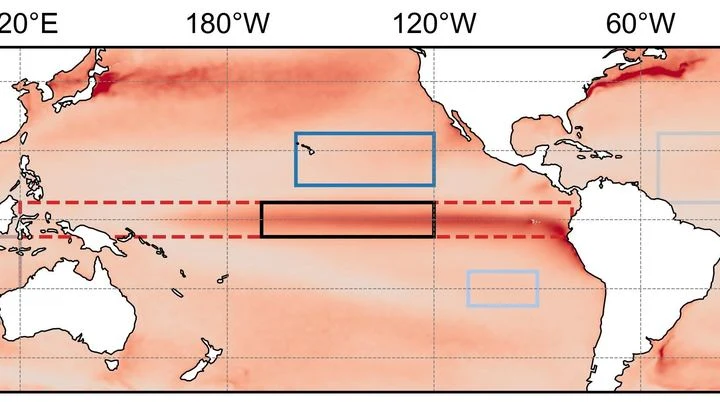
In the Pacific Ocean, there is a warm current that flows eastward against all the others. It is called the North Equatorial Countercurrent, or NECC. In normal years, this band of warm water, a few hundred kilometers wide, quietly carries heat from Indonesia toward the Americas.
Neutrinos are often compared to a radio broadcast picked up by different receivers. One station sends a signal, but antennas in Japan, Antarctica, and at the bottom of the Mediterranean Sea hear it differently — due to distance, interference, and antenna orientation.
A giant musical instrument hides underground. It picks up not sound but the trembling of space itself — gravitational waves from the mergers of dead stars. But this instrument has a problem: it is bothered by Earth's 'breathing.' Winds, storms, even the changing seasons make the ground vibrate, creating noise.
Two observers watch the Pacific Ocean. One studies surface heat maps, the other listens to the rhythm of temperature and heat stored in the water column. On their own, each notices only part of the picture, but together they can sense the approach of El Niño months before the warm current alters weather across the planet.
In 2023, the ocean off the coast of Peru warmed so much that fishermen came back empty-handed, while meteorologists argued over the strength of the upcoming El Niño. The sea surface temperature map they were looking at was the only one available, but how much could they trust it?
The ocean does not shout about its intentions. It whispers: a warm patch off the coast of Peru, a cold tongue near Hudson Bay, a barely perceptible shift in a current. The atmosphere does not respond immediately, and by winter Europe may get either mild slush or Siberian frosts.
Every few years, the Pacific Ocean off Peru warms so abruptly that fish disappear and rains flood the desert. This phenomenon is called El Niño, and it acts like a pendulum that swings the planet's climate. But when the planet itself warms, the pendulum behaves strangely: first its swing widens, then it suddenly fades.
The bronze plates of a gamelan do not sound according to a single tuning standard: each orchestra on Java keeps its own tuning, and two neighboring ensembles may play the same melody in slightly different intervals.
Two barometers hang on the wall. One reads clear, the other says partly cloudy. Which weather do you trust? That is roughly the question facing a group of climate scientists when two independent methods predicted different futures for the Pacific Ocean in 2026.
Thousands of models simmer in a single cauldron, and the steam rises thick and impenetrable. Each whispers something about the future of El Niño, but in the general din you cannot tell who is right and who is just boiling over.
The Pacific Ocean breathes slowly and deeply. Every few years, its warm surface waters shift eastward toward the coast of South America, and then Peru gets drenched while Australia goes up in flames. A year or two later, the water retreats, and the picture flips. This breathing is called El Niño, and until now its rhythm could only be guessed a couple of steps ahead.
The tropical Pacific Ocean heats and cools like a giant battery, and its rhythm affects weather from India to Canada. This rhythm is called El Niño–Southern Oscillation, or ENSO for short. Forecasting it months ahead is like predicting when a pot will boil without knowing the strength of the flame.
An orchestra of a hundred musicians plays without a conductor. As long as the score is familiar, each player confidently follows their part, and together they sound harmonious. But when the composer changes the rhythm, discord creeps in: some instruments keep playing the old tune, others try to adapt, and a few fall silent.
An orchestra of a thousand musicians plays in harmony as long as the conductor keeps the tempo. But the moment he changes the score, the violins in one corner start playing louder, while the brass in another come in late.
Two conductors stand before one orchestra. One waves the baton quickly, setting the tempo every few bars. The second is almost motionless, but his slow breathing changes the overall sound throughout the symphony. So it is in the tropical Pacific: one part of the wind governs the fast oscillations of El Niño, the other governs decadal climate shifts.
Imagine an interpreter in a negotiation room who hears the tropics whisper and repeats it too loudly. That is how the neural-network climate model DLESyM behaves when forced with real Pacific sea surface temperatures. The ocean whispers "El Niño," and the atmosphere shouts back as if being shaken by the shoulders.
Every spring, El Niño forecasts lose their edge, like a translator who gets distracted by every rustle in the room and turns a one-hour meeting into a two-hour one. Scientists call this the spring predictability barrier: in March and April, models that confidently predicted a warm phase in the Pacific back in January start making mistakes twice as often.
Imagine a pendulum that is pushed in time with the seasons: harder in winter, softer in summer. But this pendulum has a quirk: a switch that operates with a delay. When the pendulum passes through zero, the switch clicks and changes the direction of the push. That is exactly how the simplified El Niño model built by mathematicians works.
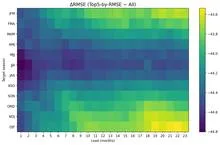
A team of forty forecasters prepares an El Niño forecast two years ahead. Each works with the same model but slightly different initial conditions and settings, so their outputs diverge. Typically, forecasting centers average all forty opinions, assuming each member is equally useful.
The ocean hums like a crowded hall: in one corner, voices argue about decades; in another, about years; in a third, about the changing seasons. To pick apart these voices, climatologists used to rely on filters they tuned themselves, letting through only slow waves or only fast ones. But the Pacific plays by its own rules: a warm patch off the coast of Peru can be a brief spike or part of a long-term rearrangement.
In a room with 80 advisors, each shouts their own opinion, and if you simply listen to everyone and take the average, you get mush. So it is with El Niño forecasts: a model produces 80 possible futures, but not all are equally useful. Some err less often, others more, and still others talk about something else entirely.
The tropical Pacific Ocean lives in two rhythms. The first is fast: a wave of thunderstorms born over the Indian Ocean races eastward and dies out off the coast of the Americas within a month or two. The second is slow: every few years, the ocean surface warms enough to alter weather across the entire planet. That is El Niño. Between these rhythms lies a bridge, and building it took climatologists decades.
You can sit on a seesaw and pump your legs, or you can just tip from one side to the other. The Pacific Ocean does both. Every few years, warm water off the coast of Peru gives way to cooler water, and rainfall patterns, winds, and entire ecosystems across half the planet reshuffle. These shifts are called El Niño and La Niña, together known as ENSO: Earth's climate seesaw.
Picture a pendulum hanging in a room with drafts. Sometimes a gust pushes it harder, sometimes softer. If the pendulum barely loses energy, it will swing long and steady. But if friction is strong, each push quickly fades, and the motion becomes jerky: a sharp swing, then a long sway. That's exactly how the tropical Pacific behaves when the heat of El Niño gives way to the cold of La Niña.
The Pacific Ocean breathes. Every few years, its warm western "lung" exhales eastward, and from Peru to Indonesia, rains, droughts, and hurricanes shift. This breath is called El Niño–Southern Oscillation, or ENSO.
An interpreter in a conference room hears not just words but intonations, pauses, and gestures. From these cues, they anticipate where the conversation will turn. The Pacific climate speaks the language of wind, heat, and currents, and PTSTnet listens like an experienced simultaneous interpreter, grasping the grammar of ocean and atmosphere.
A warm patch off the coast of Peru does not appear every year, but when it does, deserts are drenched with rain and Australia is plagued by wildfires. This is El Niño, a phenomenon that climate models struggle to reproduce. Simple models do well at estimating how often it occurs but lose spatial details.
Imagine a translator sitting in on a conversation between two parties: the ocean and the atmosphere. Usually, the translator conveys the meaning with a six-month delay, and in spring it loses the thread entirely. The new model, called CTEFNet, translates up to two years ahead and, on top of that, explains which remark turned the tide.
The Pacific Ocean, ten thousand kilometers wide, breathes: warm water shifts eastward, cold water retreats, and this in-and-out repeats every few years. A model that captures this breathing takes weeks of computation even on a supercomputer.
In the hall, fifty sages confer, each observing the ocean in their own way. One listens to surface temperature, another to the wind, a third to how heat hides in the depths. Their judgments often contradict each other, but there is an elder who knows which of them to trust more.
The Pacific Ocean is a giant network of nerve endings that warns of an impending attack a year in advance. In 2023–2024, El Niño, the warm phase of the Pacific climate oscillation, pushed global temperatures to record highs. Now, two independent methods, like two doctors examining the same symptoms, agree: no new attack in 2025.
An experienced navigator steers the ship by a well-tested chart, but in unfamiliar waters the chart lies. A cabin boy who has watched the navigator err for years learns to anticipate where the chart will fail. Together they plot a course more accurately than either could alone.
The tropical Pacific breathes in two rhythms. One lasts several years: the water off the coast of Peru warms and cools, which fishermen call El Niño. The second rhythm is fast: every month or two, a giant cloud wave is born over the warm waters of the Indian and Pacific Oceans, creeping eastward at a runner's pace and dying out near South America.
Each Atlantic hurricane season is like a game of dice, where the number of spots depends on three major climate forces: El Niño, ocean temperature in the 'hurricane nursery,' and the North Atlantic Oscillation.
The ocean breathes, and hurricanes swing on its breath like on a seesaw. Over the past seventy years, hundreds of tropical cyclones have crossed the North Atlantic, and not all of them behaved alike. Some decades brought a barrage of destructive storms to coastlines; others brought calm.
Ocean currents intertwine like sticky spider silk: every disturbance leaves a trace that does not vanish instantly. Climatologists have been used to treating random jolts in this web as invisible and memoryless, but new research shows that noise has memory, and that memory strengthens connections between distant nodes.
A fisherman casts his net into murky water, and an hour later the catch is thrashing on the deck. That's roughly how Episcanner works: it sifts through 14 years of disease records and pulls out every fever outbreak in every one of Brazil's 5,570 municipalities. From 2010 to 2023, the net caught 18,567 dengue epidemics and 2,199 chikungunya epidemics.