The Climate's Long Memory: Fractal Analysis of the Southern Oscillation Index for Alcântara ✛
Context
El Niño–Southern Oscillation (ENSO) is a key component of the global climate system, affecting atmospheric circulation on a planetary scale. For the Alcântara launch center (ALC) in northeastern Brazil, accurate surface wind forecasting is critical for launch safety. Understanding the long-term memory and chaotic nature of the Southern Oscillation Index (SOI) helps assess predictability limits and justifies the use of statistical models for regional weather forecasts.
Methods
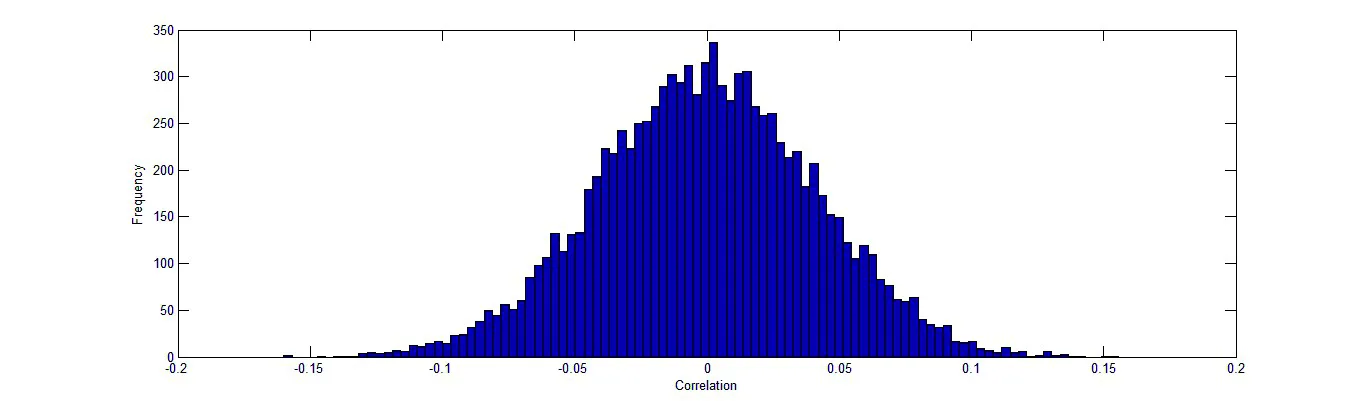
Monthly SOI data from 1951 to 2015, normalized to a base period, were used. The autocorrelation function was computed via fast Fourier transform in AutoSignal©. The Hurst exponent was estimated using the rescaled range (R/S) method and the hurstexp function from the PRACMA package in R, which provides five estimates. The largest Lyapunov exponent was calculated using the lyap_k function from the tseriesChaos package, based on Kantz's algorithm. The relationship between SOI and surface wind at São Luís Airport was tested with a permutation test using 10,000 random permutations and a 5% significance level.
Results
The SOI autocorrelation function decays to zero within 13 months but shows positive peaks around 0.14 at lags of 25–40 and 52–64 months, corresponding to quasi-biennial and 4–6-year oscillations. The simple R/S estimate of the Hurst exponent gave H = 0.561, with a fractal dimension of 1/H = 1.78; corrected estimates from the PRACMA package range from 0.694 to 0.775, reliably exceeding 0.5 and indicating persistence and long memory. The largest Lyapunov exponent was positive (λ₁ = 0.40), indicating chaotic dynamics. The permutation test revealed a significant negative correlation between SOI and mean monthly wind speed (r = −0.230, critical value −0.068), as well as between SOI and mean monthly maximum wind speed (r = −0.191, critical value −0.069). This means that during months with negative SOI (El Niño), winds in the Alcântara region are statistically stronger.
Implications
The detection of long-term memory and chaos in the SOI confirms that ENSO cannot be treated as a simple random process. A fractal dimension around 1.78 indicates moderate predictability, consistent with the known limited predictability of El Niño. The statistically significant link to local winds opens the way for autoregressive models in seasonal forecasting of wind patterns near the launch site.
Future development
Future work could focus on building operational autoregressive models to forecast surface winds at Alcântara using SOI and other climate indices. It would also be interesting to examine how the Hurst exponent and fractal dimension of SOI vary across different time windows, potentially revealing non-stationarity in long-term memory and its connection to decadal Pacific variability.
Impact
The results could improve seasonal forecasting of wind conditions for the Alcântara launch center, enhancing launch safety. The methodology is applicable to other climate indices and regional meteorological time series.
Next steps
The next step could be to build and validate an autoregressive model that includes SOI as a predictor for wind speed at Alcântara. It would also be useful to perform similar analyses for other months of the year and for data with broader spatial coverage.
Key open problems
This work directly addresses the predictability of El Niño–Southern Oscillation, a central issue in climatology. The question of how long-term memory and chaotic dynamics limit the forecast horizon remains unresolved. For Alcântara meteorology, quantifying the contribution of ENSO to surface wind variability relative to other factors, such as the Atlantic dipole, remains an open challenge.
The knowledge machine's view
This section is addressed to the author of the paper and their colleagues. Neighbouring works were found by meaning-based search across our archive, not by word overlap. We do not review: we show the field around the work.
What the work does
This study performs a fractal analysis of the Southern Oscillation Index (SOI) from 1951 to 2015, estimating the Hurst exponent, fractal dimension, and largest Lyapunov exponent, which reveal the series' persistence and chaotic nature. A permutation test shows a significant negative correlation between SOI and wind speed at São Luís airport, supporting the use of autoregressive models for seasonal wind forecasting near the Alcântara launch center.
Where its strength is
Its strength lies in combining nonlinear dynamics methods with the practical challenge of wind forecasting for a spaceport, turning abstract fractal characteristics into a working tool for regional meteorology.
Where it could go next
- It might be interesting to see how machine learning methods used for solar flare analysis could be adapted to account for the chaotic component of SOI in wind forecasting.based on: Solar Flares: Forecasting with Confidence arXiv:2603.06712
- A related study on seasonal space weather variations may offer approaches for extracting quasi-periodic components, which could help separate ENSO and other modes' contributions to wind patterns at Alcântara.based on: Space Weather by the Seasons arXiv:2605.27057
- There is an analysis in the archive where fractal and chaotic characteristics were applied to solar flares; ideas on interpreting the Hurst exponent and dimension for geophysical series might be borrowed from there.based on: How Artificial Intelligence Read the Magnetic Handwriting of Solar Flares arXiv:2607.15719v1
Worth trying
- Test whether incorporating nonlinear terms (e.g., threshold effects from SOI) improves the quality of autoregressive wind forecasts compared to a linear model.
- Compare the predictive power of models trained on different ENSO phases to assess how much chaos limits the forecast horizon.
- Try an ensemble approach, similar to those used in solar flare forecasting, to account for uncertainty associated with a positive Lyapunov exponent.
Nearby works in our archive
- How Artificial Intelligence Read the Magnetic Handwriting of Solar Flaressimilarity 0.48
- The Dance of Gears: Why Some Black Holes Blow Winds and Others Shoot Jetssimilarity 0.47
- Black Hole Jet Makes a Sharp Turnsimilarity 0.47
- Space Weather by the Seasonssimilarity 0.47
- Solar Flares: Forecasting with Confidencesimilarity 0.46
- How Radio Signals Reveal Secrets of the Solar Windsimilarity 0.46
The archive is sparse around this work: the closest review is only 0.48, against a usual 0.64. It looks like few have drilled nearby.
The Southern Oscillation Index is calculated from the difference in atmospheric pressure between Tahiti (in the Pacific Ocean) and Darwin (in Australia, on the shore of the Indian Ocean). These two points are about 7,500 kilometers apart, yet their out-of-phase 'breathing' reflects global shifts in tropical circulation.
Key numbers
- Hurst exponent (simple R/S estimate): 0,561
- fractal dimension: 1,78
- largest Lyapunov exponent: 0,40
- correlation of SOI with mean monthly wind speed: −0,230
- critical correlation value at 5% level: −0,068