Why One El Niño Is Visible Two Years Ahead, Another Only Six Months
Original: "Quantifying the Predictability of ENSO Complexity Using a Statistically Accurate Multiscale Stochastic Model and Information Theory"
· Xianghui Fang, Nan Chen
arXiv:2203.02657 · 2022-03-05 · CC BY 4.0 · 1 min
Forecasting works like a flashlight in fog: for some events the beam reaches far, for others it dies out almost immediately.

A flashlight in fog picks out some objects and fails to reach others. So it is with El Niño forecasts: the warm patch in the Pacific that brings droughts and floods around the world. Some events are visible two years ahead, others only six months.

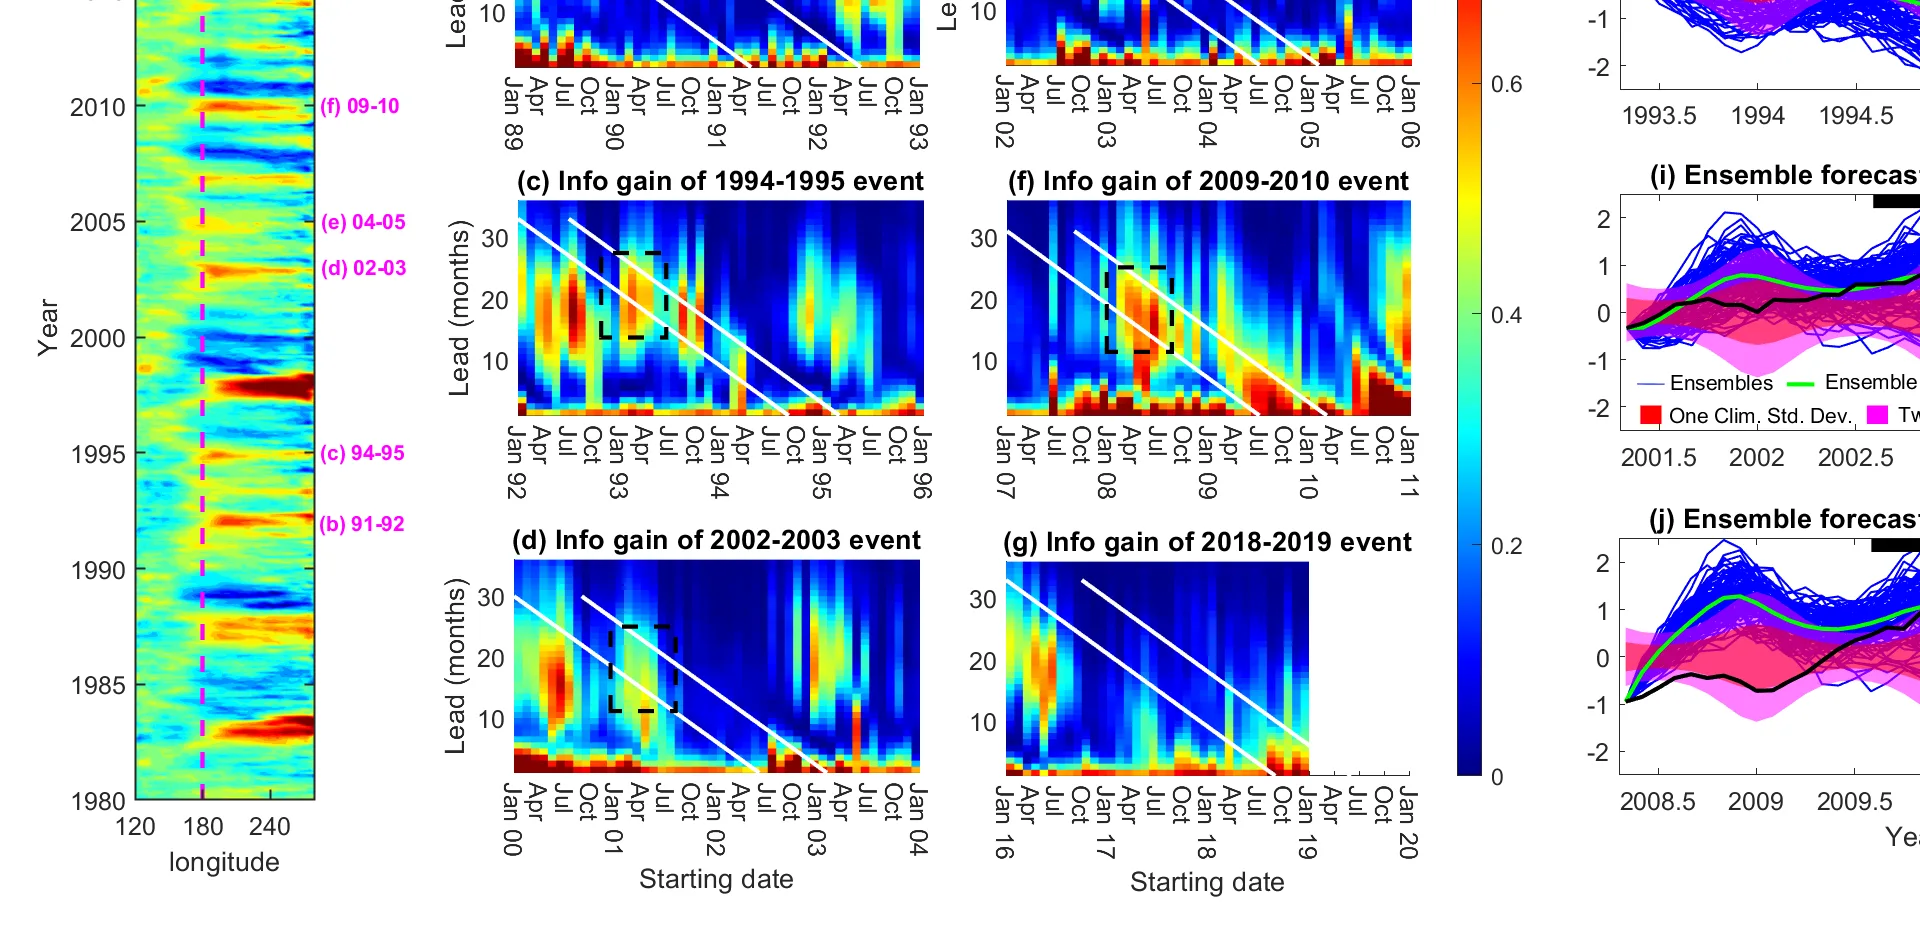
To understand why, scientists ran two thousand versions of the future from the same starting state. Each version is like a separate flashlight beam, slightly jittering from random wind gusts. If the beams travel together for a long time, the future is predictable; if they quickly spread apart, it is not.

It turned out that beams hold warm patches in the central ocean together for about twenty months, but off the coast of South America only six to ten. Cold events, La Niña, are visible even farther ahead.

The practical benefit is simple: meteorologists now know for which events it is worth attempting a long-range forecast, and for which it is pointless. And they know that what needs improving is not just the average beam, but also how much the beams jitter.

The information gain for central Pacific El Niño remains significant 20 months before the event, even though the ensemble mean in some cases is still far from the truth: some ensemble members 'guess' the event, while others do not.

P(p(t), p_{clim}) = \int p(t, u) \log\left(\frac{p(t, u)}{p_{clim}(u)}\right) du
Measure of additional information in the forecast compared to climatology
P = \frac{1}{2}(\bar{u} - \bar{u}_{clim})^2 R_{clim}^{-1} - \frac{1}{2}\log(R R_{clim}^{-1}) + \frac{1}{2}(R R_{clim}^{-1} - 1)
Decomposition into signal part (difference of means) and dispersion part (difference of covariances)
E = 1 - \exp(-P)
Maps information gain to the interval from 0 to 1
Concepts
spring predictability barrier Multivariate ENSO Index El Niño index ENSO ERSST El Niño-Southern Oscillation forecast equatorial wave propagation ensemble forecast Jin-Timmermann model NOAA PMEL / TAO NOAA CPC information theory uncertainty estimation interannual variability TAO/TRITON moorings zebiak cane model Warm water volume Southern Oscillation La Niña