Why El Niño First Strengthens and Then Weakens ✛
Every few years, the Pacific Ocean off the coast of Peru warms so abruptly that fish disappear and rains flood the desert. This phenomenon is called El Niño, and it acts like a pendulum that swings the planet's climate. But when the planet itself warms, the pendulum behaves strangely: first its swing widens, then it suddenly fades. Why does that happen?
The reason is that the ocean warms unevenly. The upper layer, which touches the air, warms quickly. Deeper layers, especially water at about a hundred meters depth, lag behind by decades. It's like heating an old house: the radiator by the window heats up right away, but the far wall only warms an hour later. While the top is warm and the bottom is cold, the boundary between them acts like a taut string: any disturbance travels along it more strongly. So in the first decades of warming, El Niño indeed intensifies.
But there is a second process. The winds that blow along the equator from east to west push warm water toward Indonesia. As the climate warms, these winds weaken. The conveyor slows, and the temperature difference between west and east diminishes. That means El Niño has less energy to draw from. The pendulum begins to fade.
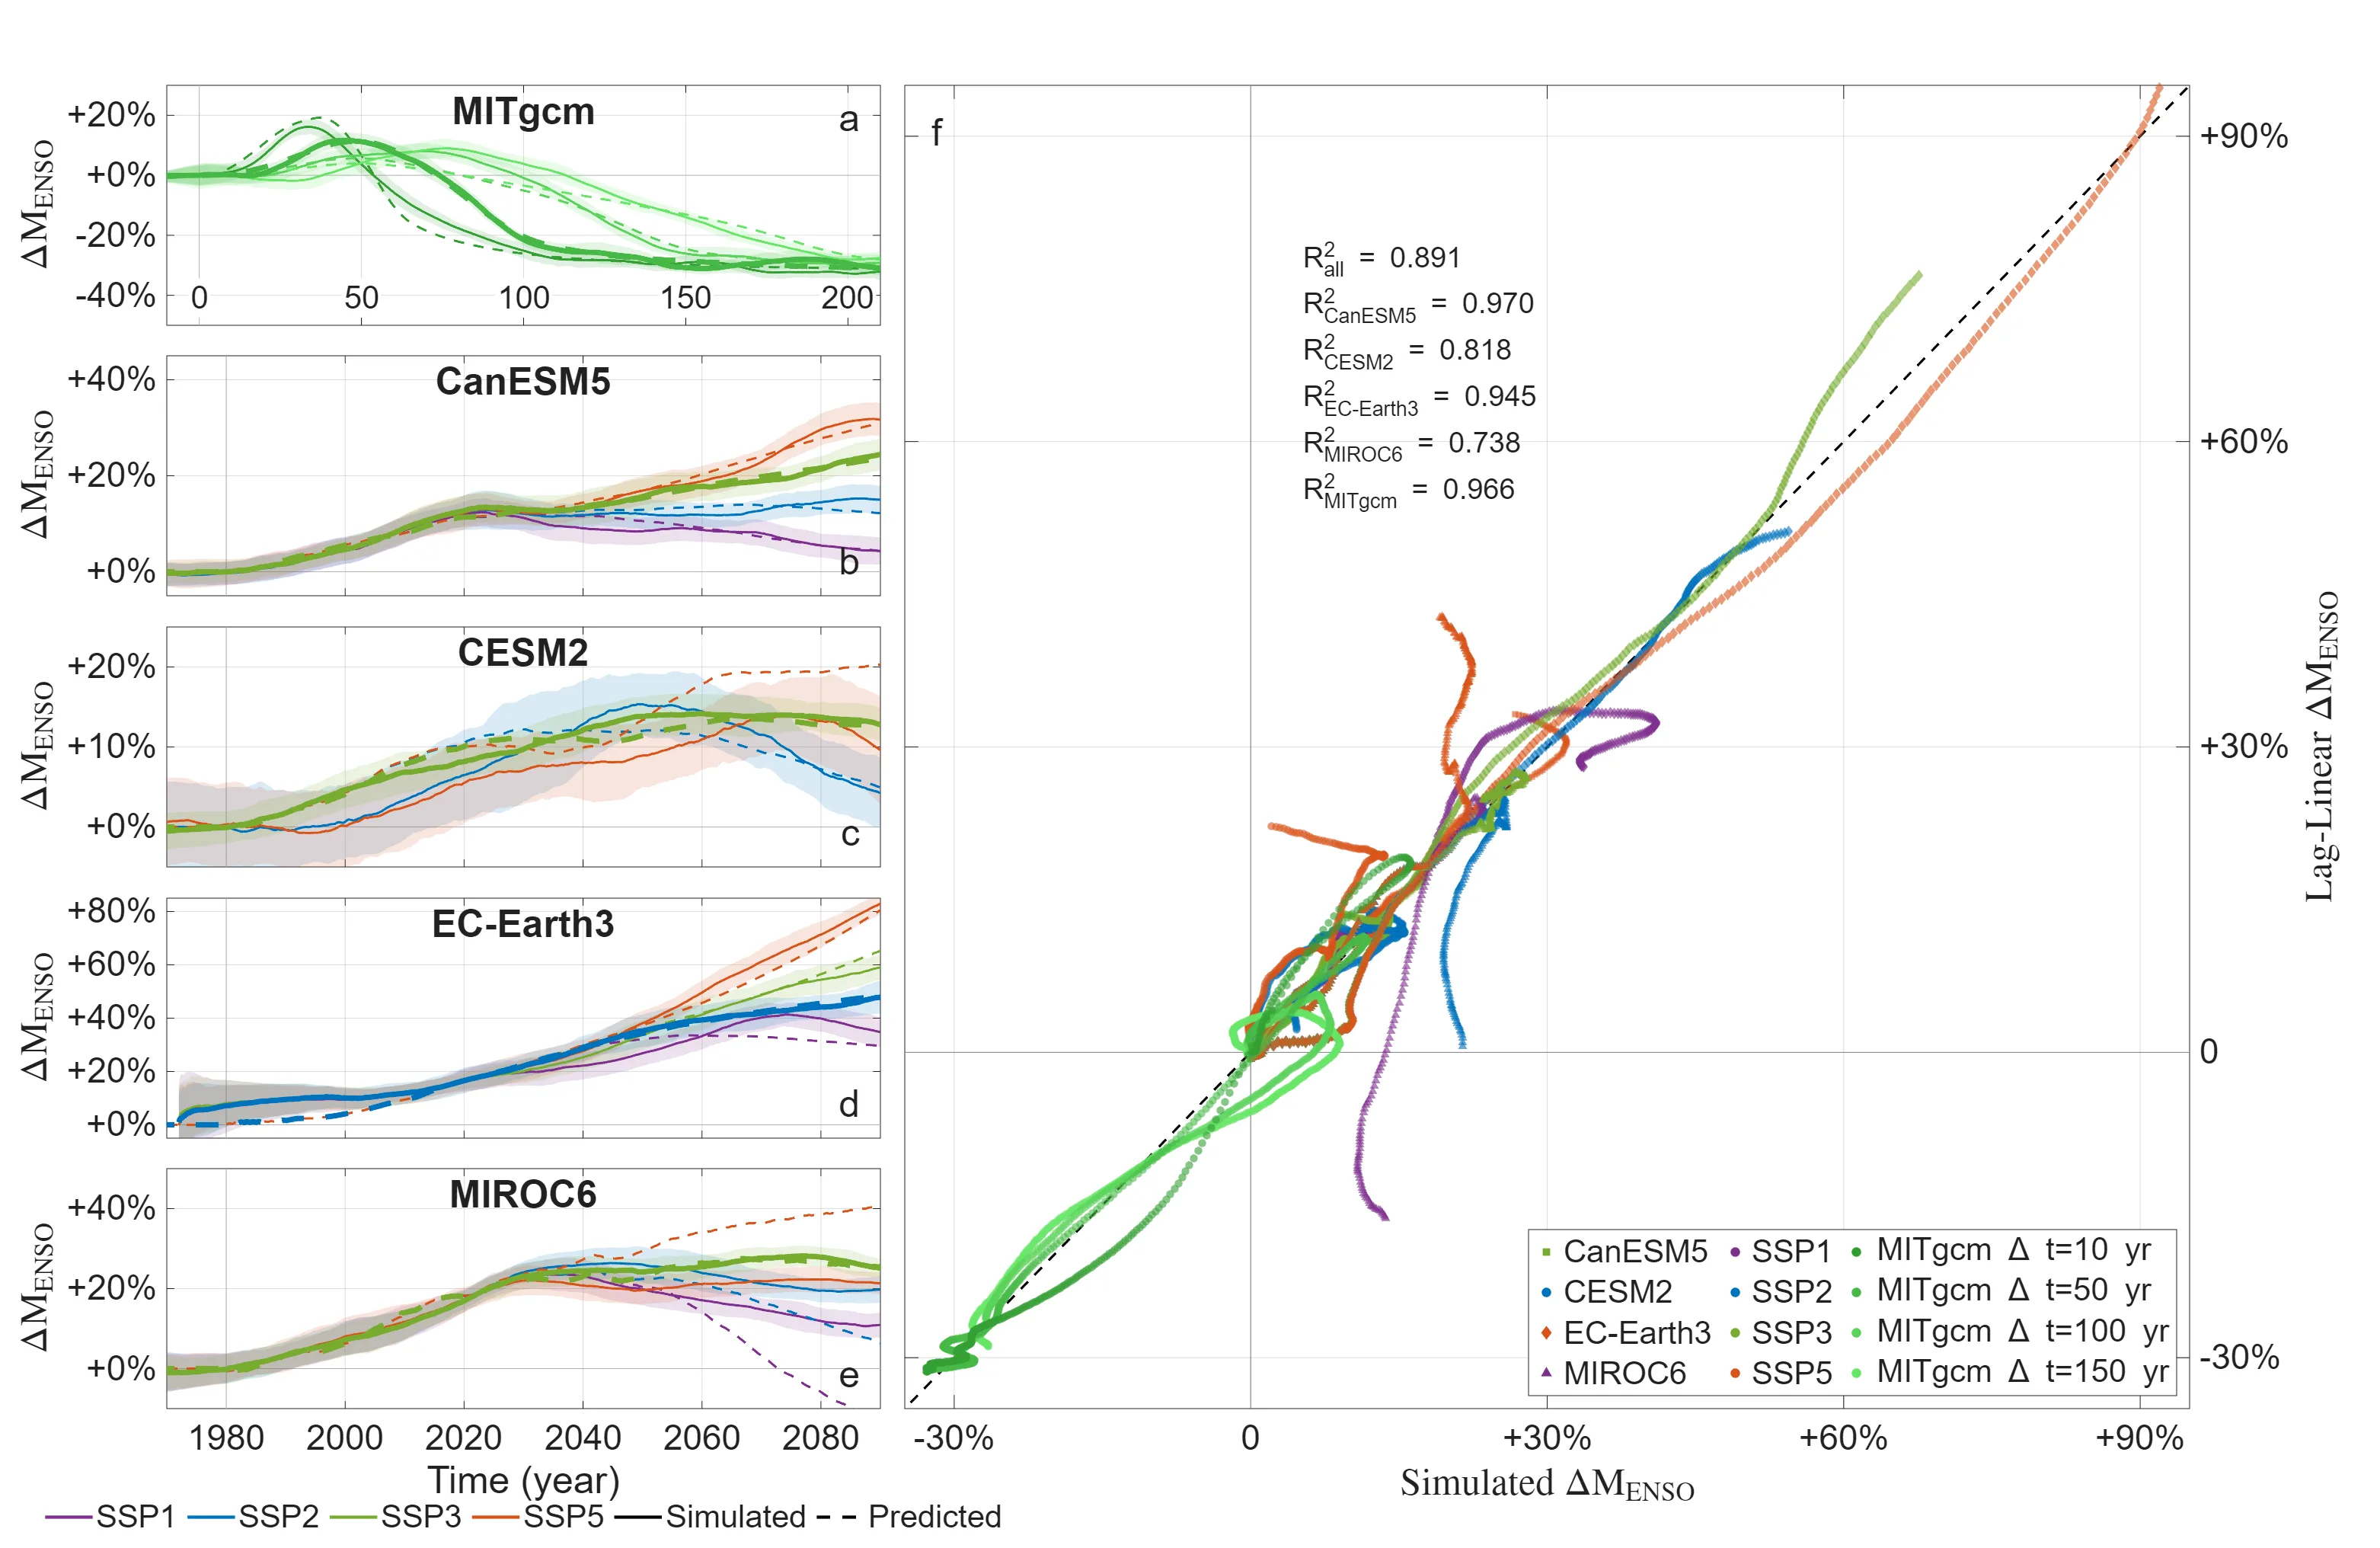
Scientists built a model that accounts for this lag between surface warming and deep warming. It takes today's surface temperature and the surface temperature from thirty-six years ago, and from these two numbers predicts El Niño's strength. Across different climate models, this simple formula explains about ninety percent of the variability. The peak swing occurs roughly fifty years after warming begins, and by the end of the century El Niño strength could drop by forty percent relative to preindustrial levels. A pendulum that is swung and then damped is an apt description of how the climate system works.
Economic losses from the extreme El Niño events of 1997–1998 and 2015–2016 are estimated at 4.1 and 5.7 trillion dollars, respectively, while La Niña brings only modest economic benefits.