The Rise and Fall of El Niño in a Warming World ✛
Context
This work stands apart in climate variability research: its nearest neighbors study El Niño predictability up to a year and a half ahead, long-term fate of vegetation, thermal vents in Enceladus's ocean, stability of the ocean conveyor belt, and changing rainfall regimes. All of them, in one way or another, address the climate system's response to external forcing, but this paper stands out by offering not a diagnosis or forecast of a specific phenomenon, but a universal and cheap method to predict ENSO strength centuries ahead for any emission scenario. It is the first work to reduce ENSO evolution to two variables, mean temperature and stratification, and obtain an analytical expression for the variability peak.
Methods
The authors use a hierarchy of models: idealized MITgcm simulations with different warming rates (from 10 to 150 years), CMIP6 ensembles for SSP scenarios and abrupt CO2 quadrupling, and ERA5 reanalysis data. The key step is constructing an energy budget for the upper 80-meter layer of the eastern equatorial Pacific, linking growth of El Niño temperature anomalies to changes in mean currents, temperature gradients, stratification, and surface fluxes. This budget is then linearized and simplified to a linear dependence of ENSO strength on mean temperature and stratification. Finally, stratification is expressed in terms of subsurface temperature, which lags surface temperature by about 36 years (the time of subtropical cells), yielding a lagged linear model with three parameters.
Results
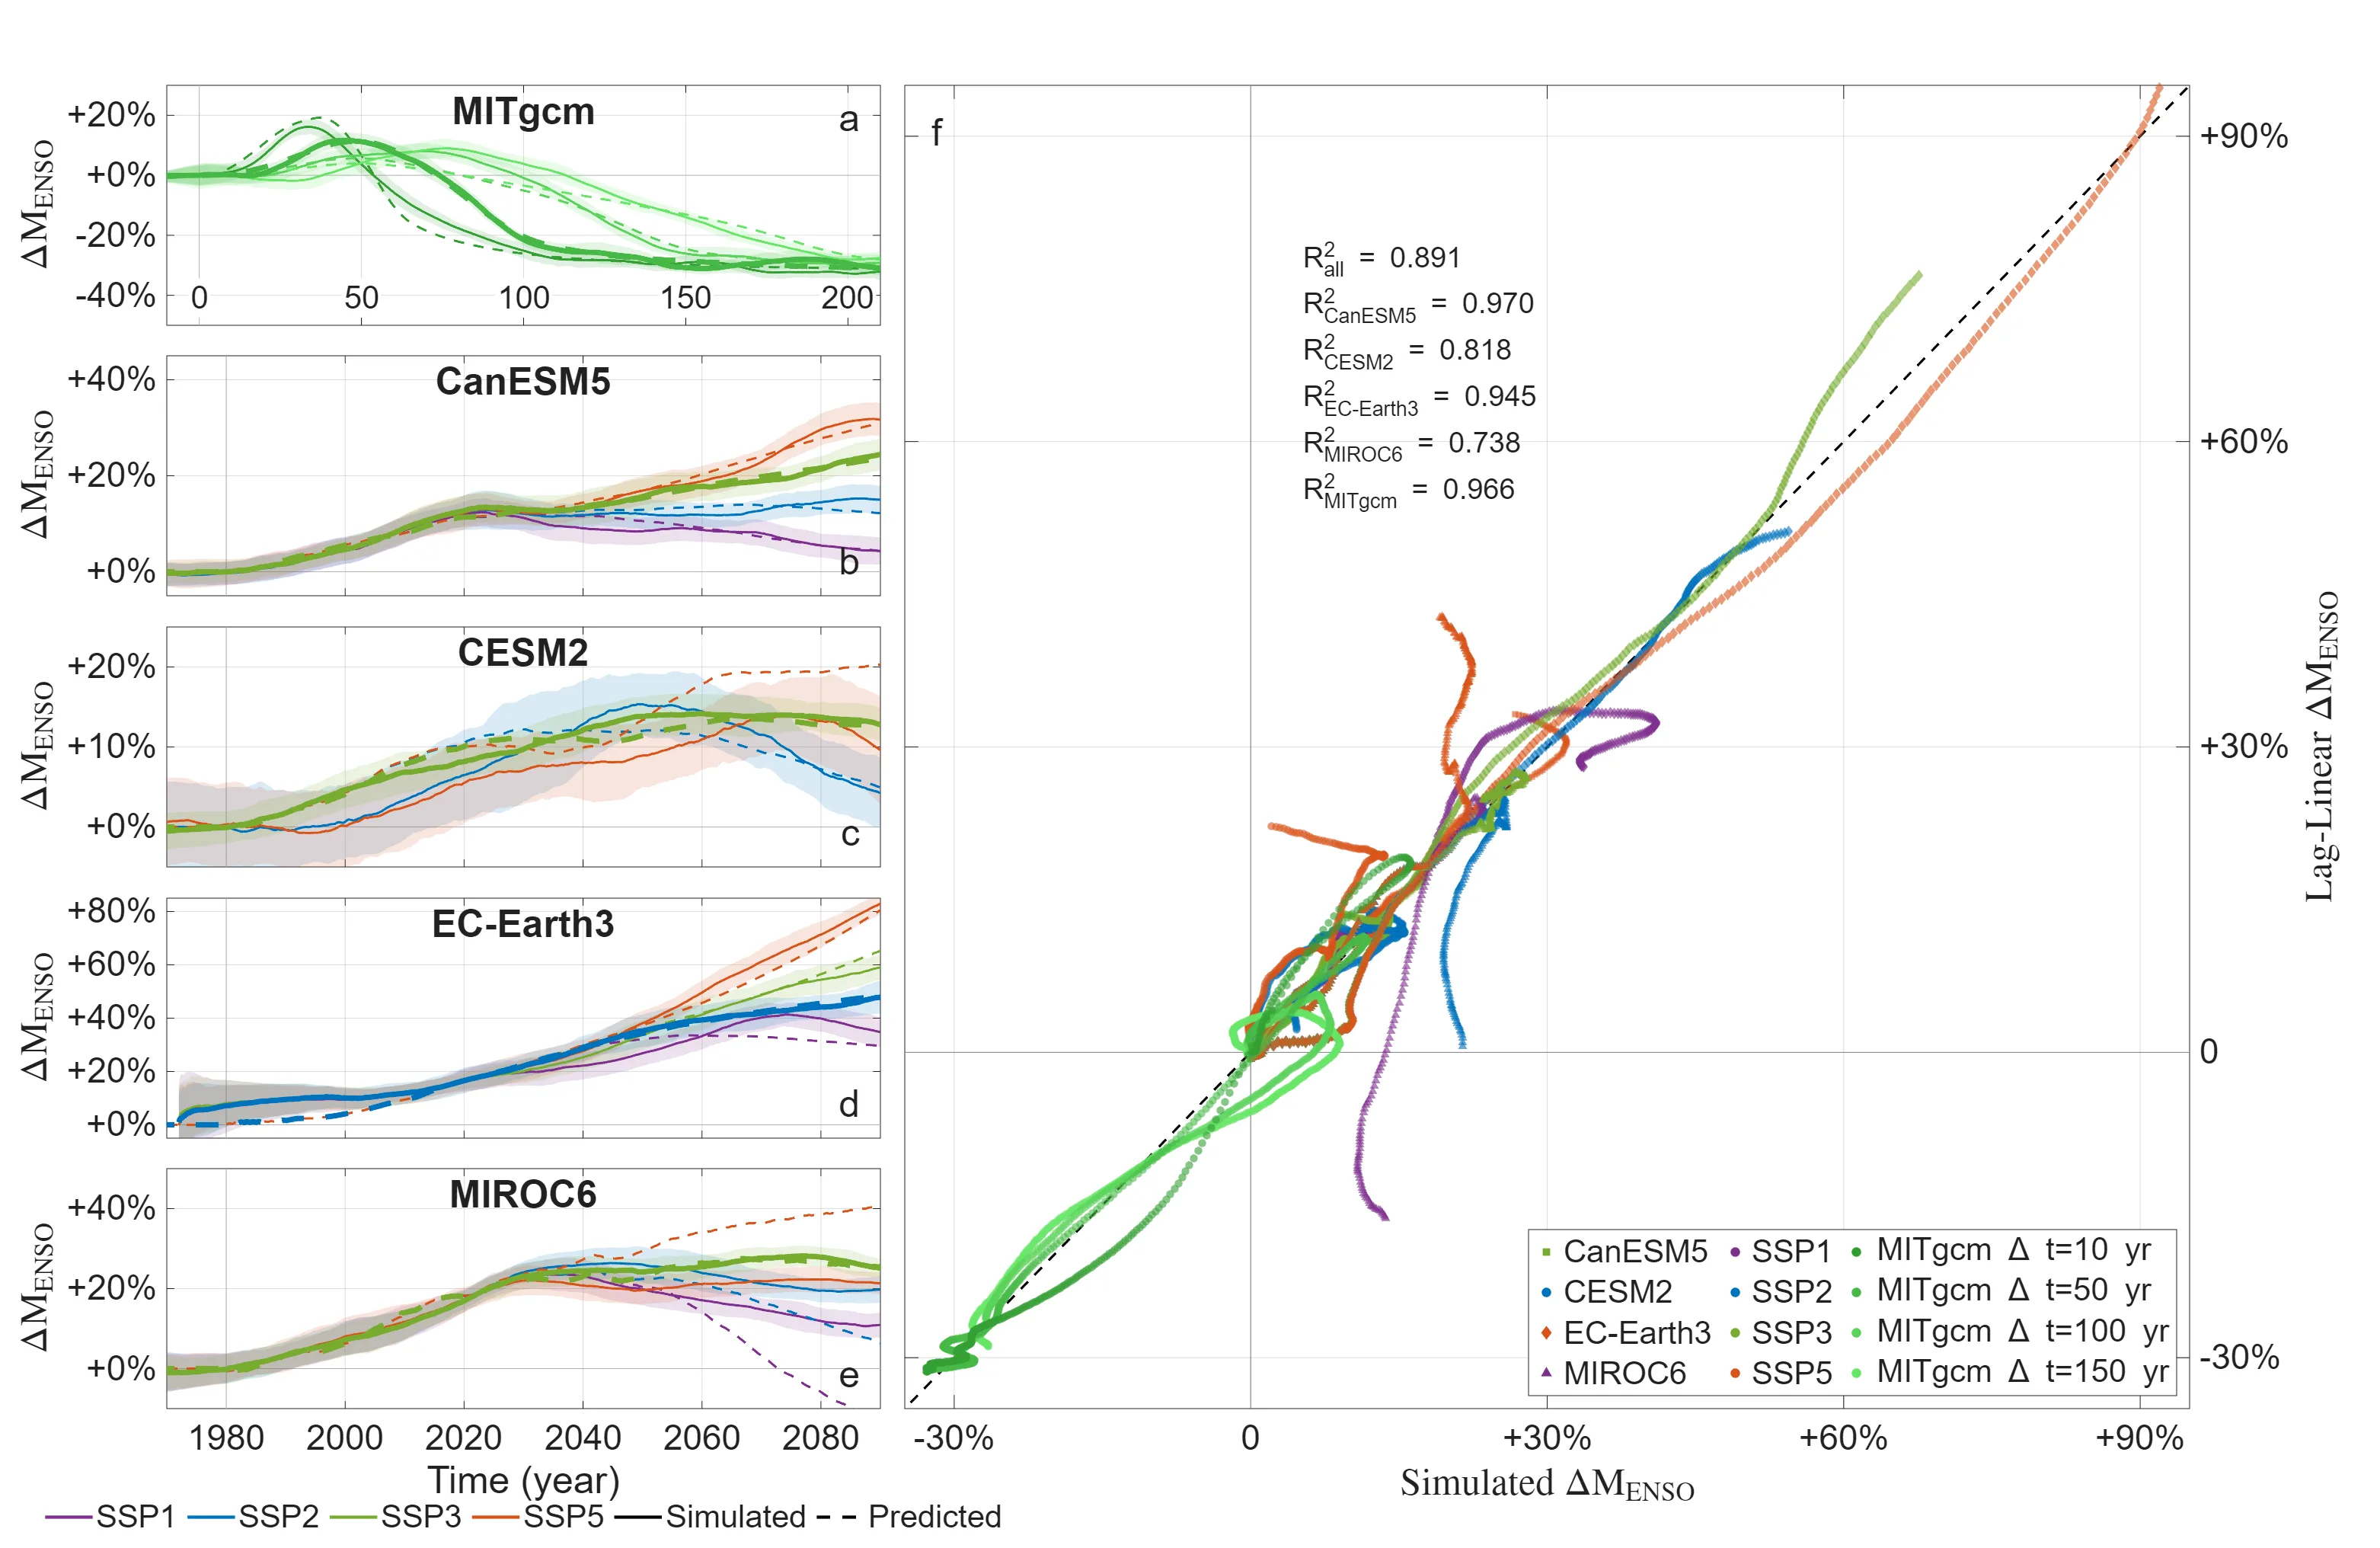
The lagged linear model explains about 90% of ENSO strength changes in MITgcm, CanESM5, CESM2, EC-Earth3, and most CMIP6 models under abrupt CO2 quadrupling. In idealized simulations, the ENSO peak occurs about 50 years after the start of warming and reaches +10% relative to the initial amplitude, then strength falls to −40% of the preindustrial level. The analytical solution shows that the peak amplitude is proportional to the amount of warming and depends on the ratio of the subtropical cell time to the warming time: the faster the emissions, the stronger the ENSO peak. For example, SSP5-8.5 gives a peak of about +20% and retains elevated variability until the 22nd century, whereas SSP2-4.5 gives only +15% with a peak around 2100.
Implications
Unlike neighboring works that either diagnose the current state of the system or forecast specific scenarios using full models, this paper offers a physically based and computationally cheap predictor applicable to any emission scenario. It is the first demonstration that the complex evolution of ENSO reduces to two slow variables, and that the variability peak has a simple analytical expression. This approach paves the way for rapid assessment of the social cost of carbon that accounts for the temporal dynamics of ENSO, and for quick risk analysis for agriculture and infrastructure without running climate model ensembles.
Future development
The method can be extended to other climate modes, such as the North Atlantic Oscillation or the Pacific Decadal Oscillation, if their response to warming is also determined by a small number of variables. For paleoclimate reconstructions of ENSO, the lagged linear model could become a tool for testing hypotheses about the link between variability and temperature and basin configuration. Furthermore, the identified connection between the subtropical cell time and the lag of subsurface warming points to the need for more accurate modeling of this process in climate models.
Impact
This work will affect economic estimates of damage from climate disasters, adaptation planning in agriculture, and insurance models that account for the frequency of extreme El Niño events. It also gives climate scientists a quick way to test how sensitive conclusions are to the emission scenario.
Next steps
The next step is to apply the lagged linear model to ENSO forecasts for the coming decades using observational data and refine parameters for individual models. It is also important to investigate why, in some models (e.g., MIROC6), the linear approximation works less well, and which nonlinearities need to be included.
Key open problems
This work directly addresses an unresolved problem in climatology: why models diverge in their estimates of future ENSO amplitude, and how to reduce this uncertainty. It also touches on the fundamental question of the role of ocean stratification and circulation in the response of the tropical climate system to external forcing.
The knowledge machine's view
This section is addressed to the author of the paper and their colleagues. Neighbouring works were found by meaning-based search across our archive, not by word overlap. We do not review: we show the field around the work.
What the work does
The study builds a lag-linear model linking ENSO strength to mean surface temperature and upper-ocean stratification. The model reproduces about 90% of ENSO amplitude variations across a hierarchy of models and provides an analytical solution for the timing and amplitude of the variability peak under different emission scenarios.
Where its strength is
The strength of the work lies in reducing the complex evolution of ENSO to two slow variables and deriving a simple analytical expression for the variability peak, which allows rapid assessment of ENSO response to arbitrary emission scenarios without running full climate models.
Where it could go next
- It might be interesting to compare the obtained time scales of the ENSO peak with the predictability of El Niño on interannual scales: a paper on forecasting El Niño one and a half years ahead is nearby in the archive, and comparing physical mechanisms across different time horizons could clarify how universal the identified variables are.based on: El Niño Can Be Predicted a Year and a Half in Advance arXiv:2601.12251
- A paper on the heat pump in Enceladus's ocean is also nearby, which similarly considers the energy balance of an oceanic layer under external forcing; possibly transferring ideas about the upper-layer energy budget to other planetary bodies could help test the generality of the approach.based on: Enceladus's Ocean — A Perfect Heat Pump arXiv:2603.22602
Worth trying
- Test whether the lag-linear model works for other phenomena of interannual variability, such as the Indian monsoon, using reanalysis data.
- Use the analytical solution to estimate the social cost of carbon under different emission rates, comparing with results from integrated assessment models.
Why this may matter
If the proposed method proves applicable to other components of the climate system, it could offer a simple tool for fast evaluation of climate risks and the social cost of carbon under arbitrary emission scenarios, which is important for decision-making.
Nearby works in our archive
- El Niño Can Be Predicted a Year and a Half in Advancesimilarity 0.53
- Solar Cycles: How Magnetic Swings Sway the Futuresimilarity 0.51
- Enceladus's Ocean — A Perfect Heat Pumpsimilarity 0.49
- The Climate Swings of Ancient Marssimilarity 0.49
- The Fourth Spring of Climatesimilarity 0.49
- How Neutrinos Switch Flavors While Traveling Through the Sunsimilarity 0.48
The archive is sparse around this work: the closest review is only 0.53, against a usual 0.64. It looks like few have drilled nearby.
Economic losses from the extreme El Niño events of 1997–1998 and 2015–2016 are estimated at 4.1 and 5.7 trillion dollars, respectively, while La Niña brings only modest economic benefits.
Key numbers
- ENSO intensification peak in idealized simulations: +10% relative to initial amplitude
- Long-term ENSO weakening: down to −40% of preindustrial level
- Lag of subsurface warming: about 36 years
- Fraction of variance explained in MITgcm: R² = 0.98
- Economic damage from 2015–2016 El Niño: 5.7 trillion dollars