Why El Niño Comes in Different Flavors
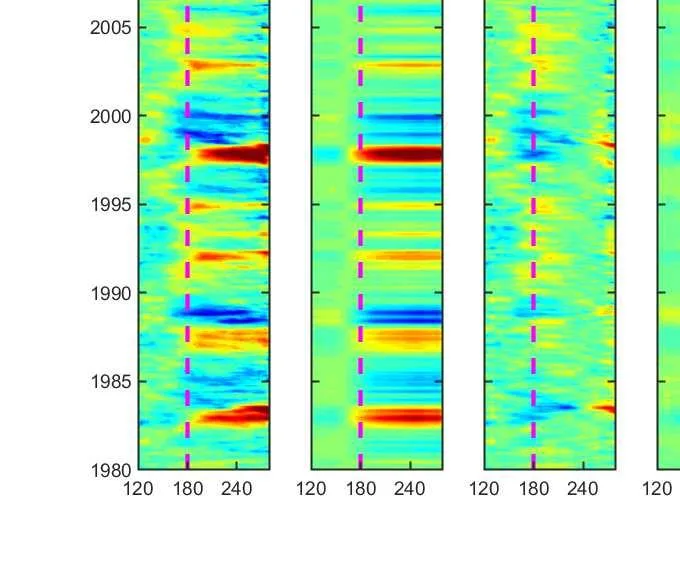
The Pacific Ocean works like an orchestra with three conductors. One conductor waves the baton fast: these are wind bursts that blow now from the west, now from the east. The second conductor moves more slowly: these are heat waves that travel across the ocean for years. The third conductor is almost invisible: this is the background air circulation that changes over decades. All three together control El Niño, the warm patch in the ocean that influences weather across the entire planet.
Previously, scientists thought El Niño was a simple seesaw: warm water near the coast of South America alternates with cold water, and so it goes every few years. But the seesaw often breaks. The warm patch can appear not near the coast but in the middle of the ocean, or the cold phase can drag on for three winters in a row. For a long time, scientists couldn't understand why this happens, and forecasts often missed the mark.
The new model brings all three rhythms together. Fast wind bursts act as random pushes, and the strength of each push depends on how much the water has already warmed. Slow heat waves slosh between the western, central, and eastern parts of the ocean. And the background rhythm alters the overall air circulation, making certain types of events more likely. The model was run 2000 years into the future, and it produced 660 warm events and 852 cold events, with 60% of warm events near the coast and 40% in the central ocean, matching real observations.
Now scientists have a tool that shows not only what will happen but also why. The model can be used for forecasts, for training computer programs, and for testing how global warming might change the character of El Niño. The orchestra of three conductors has finally played in tune, and its score helps us hear what the next music of the Pacific will be.
In the model simulation over 2000 years, extreme El Niño events occur on average every 16 years, while in observations since 1950 they occur every 10–20 years. The model even reproduced the delayed extreme El Niño of 2015–2016, when the first westerly wind burst initiated an event, but an easterly burst killed it, and only the next series of bursts brought it to an extreme.