Three Rhythms of El Niño: A Model of Complexity
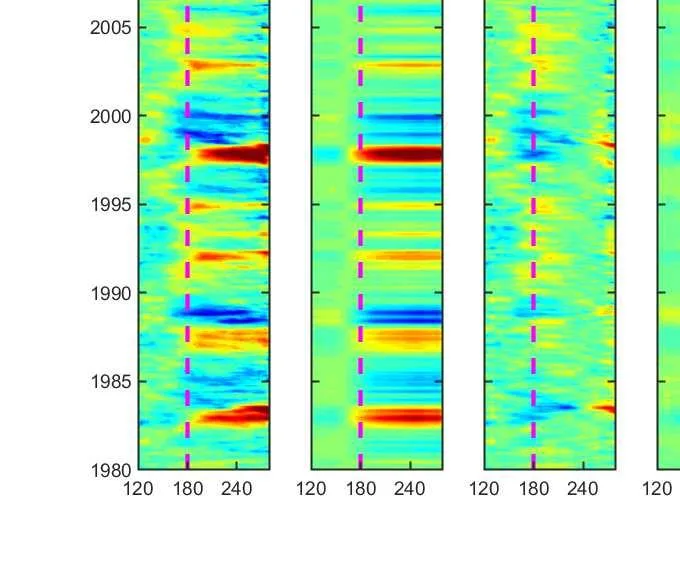
An orchestra of three conductors governs the Pacific climate. The first conductor is intraseasonal wind bursts, blowing now from the west, now from the east, like random plucks on strings. The second is the interannual ocean dynamics, slowly rocking warm and cold waves. The third is the decadal background of the Walker circulation, which changes as unhurriedly as audience tastes, deciding which music gets more applause.
Previously, El Niño was seen as a simple seesaw: warm water off South America gives way to cold, and so on every few years. But observations showed that the seesaw sometimes breaks. A warm patch appears not near the coast but in the ocean's center, or an event lingers for a year, or the cold phase stretches over three consecutive winters. Scientists called this diversity, and it hampered forecasts: a model tuned to one event type failed on another.
The new model assembles all three rhythms into a single score. Intraseasonal wind bursts act as random pushes, with the push strength depending on how much the central ocean has already warmed. Interannual dynamics describe how heat flows between the western, central, and eastern Pacific. And the decadal background slowly shifts the overall air circulation, making some event types more likely than others.
The model also explained the asymmetry: multi-year La Niñas numbered 209, while multi-year El Niños only 100. In reality, the cold phase indeed tends to persist for several years more often than the warm phase. The reason is that eastern Pacific events are mostly triggered by random wind bursts, whereas central Pacific events arise from nonlinear ocean dynamics that self-limit. The decadal background acts as a slow switch, enhancing the frequency of one type or the other.
Now climatologists have a tool that not only predicts but reveals the mechanism. The model can serve as a generator of synthetic data for training neural networks, as a testbed for assessing global warming's impact on El Niño behavior, and as a basis for ensemble forecasts. The orchestra of three conductors has finally played in harmony, and its score helps us hear what the next music of the Pacific will be.
In the model simulation over 2000 years, extreme El Niño events occur on average every 16 years, while in observations since 1950 they occur every 10–20 years. The model even reproduced the delayed extreme El Niño of 2015–2016, when the first westerly wind burst initiated an event, but an easterly burst killed it, and only the next series of bursts brought it to an extreme.