Three Rhythms of El Niño: A Model of Complexity
Context
El Niño–Southern Oscillation (ENSO) is the most prominent interannual climate phenomenon on the planet: warm and cold sea surface temperature anomalies in the equatorial Pacific affect weather, ecosystems, and economies worldwide. The classical picture of cyclic behavior has given way to an understanding of diversity: there are at least two types of El Niño, eastern Pacific (EP) and central Pacific (CP), which differ in the location of the maximum anomaly. A shift in the heating region changes atmospheric responses and greatly complicates forecasting. In the archive around this paper lie studies on the large-scale structure of the universe, randomness in evolution, El Niño predictions a year and a half ahead, maps of atomic nuclei, neural network training on the Ising model, gravitational maps of galaxies, voltage fluctuations in trains, and recipes for neurochips. This work stands apart: the nearest neighbor is at a distance of 0.516, with no close works. The thematic group is large-scale structure, large-scale structure of the universe, convolutional neural networks, and machine learning. Among the neighbors are works on complexity modeling and machine learning, but there is no direct overlap with ENSO.
Methods
The authors built upon a deterministic three-region conceptual model with zonal advective feedback, an extension of the classic recharge oscillator model that describes ocean–atmosphere interactions in the western, central, and eastern Pacific. They added two stochastic processes. The first is intraseasonal wind bursts (westerly and easterly, as well as the Madden–Julian convective envelope) with multiplicative noise that depends on the central Pacific temperature. The second is decadal variability of the background Walker circulation, described by a simple stochastic differential equation with a positive lower bound. Seasonal phase locking is incorporated through periodic damping coefficients and burst amplitudes. Model parameters were determined from observational data for 1980–2020: GODAS for the ocean, NCEP–NCAR for the wind. To reproduce the non-Gaussian statistics in the central region, they introduced cubic damping, justified by an analysis of the mixed-layer heat budget.
Results
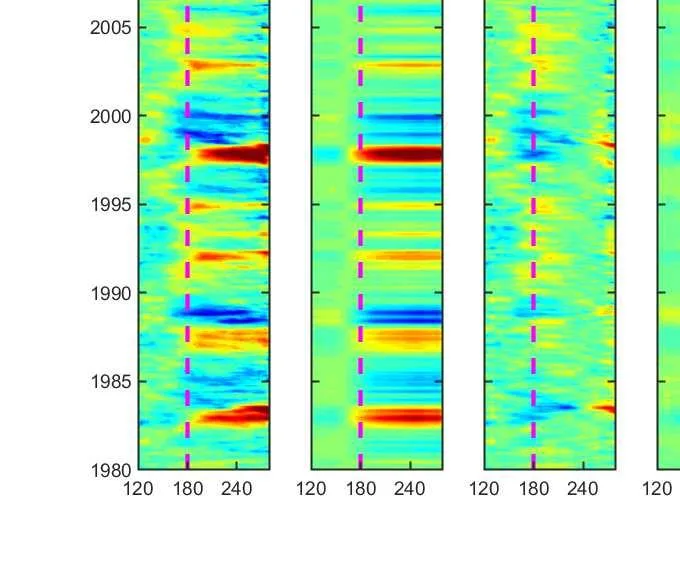
The model reproduces key statistics of observed ENSO: power spectra of temperature in the Niño-3 and Niño-4 regions, non-Gaussian distributions (positive skewness and heavy tail in Niño-3, negative skewness and light tail in Niño-4), and seasonal phase locking with a later onset of central Pacific events. Over a 2000-year simulation, the model produced 660 El Niño and 852 La Niña events; among El Niño, 60% were eastern Pacific and 40% central Pacific, matching observations (58% and 42%). Extreme El Niño events occur on average every 16 years, as in reality (10–20 years). Multi-year La Niña events numbered 209 versus 100 multi-year El Niño, reflecting the observed asymmetry. The model also reproduces delayed extreme El Niño, isolated and successive central Pacific events, mixed types, and multi-year La Niña.
Implications
This work shows that the observed complexity of ENSO arises from the interaction of three time scales: intraseasonal, interannual, and decadal. Unlike neighboring works on machine learning and large-scale structure, here a physically motivated conceptual framework is proposed that not only predicts but reveals mechanisms. The model demonstrates that eastern Pacific events are mainly stochastically excited by wind bursts, while central Pacific events arise from nonlinear dynamics with zonal advection. Decadal variability of the background Walker circulation modulates the frequency of both types. This is the first stochastic model of its kind to reproduce the full set of observed complexity characteristics.
Future development
The model can be extended by adding more detailed physical processes, such as subtropical atmospheric forcing, which is currently parameterized as noise. It is possible to include additional feedbacks or a more realistic description of decadal variability. Another direction is to use the model as a generator of synthetic data for training ENSO forecasting neural networks via transfer learning, which is especially valuable when observational data are limited.
Impact
The results will influence ENSO forecasting, climate modeling, and the understanding of extreme events. The model can serve as a testbed for assessing the impact of global warming on El Niño behavior.
Next steps
Conduct ensemble forecasts with data assimilation into the model. Use the model to generate millennial time series and train machine learning algorithms on them, followed by fine-tuning on real data.
Key open problems
Connection to unsolved problems in climatology: why multi-year La Niña events are more frequent than multi-year El Niño, and how decadal variability of the background state controls the transition between EP and CP regimes. The model provides a tool for testing hypotheses about the causes of asymmetry and changes in event frequency in the 21st century.
In the model simulation over 2000 years, extreme El Niño events occur on average every 16 years, while in observations since 1950 they occur every 10–20 years. The model even reproduced the delayed extreme El Niño of 2015–2016, when the first westerly wind burst initiated an event, but an easterly burst killed it, and only the next series of bursts brought it to an extreme.
Key numbers
- frequency of extreme El Niño: every 16 years in the model, 10–20 years in observations
- share of eastern Pacific El Niño: 60% in the model, 58% in observations
- share of central Pacific El Niño: 40% in the model, 42% in observations
- number of multi-year La Niña versus El Niño: 209 versus 100 over 2000 years
- simulation period: 2000 years