Climate as a Layered Cake: How Much Heat Comes from Humans and How Much from the Ocean
Warm air rises from a radiator, and the room seems to heat evenly. But if you put your hand against the wall by the window, it feels cooler than by the door. Earth's climate works similarly: global warming is not spread in a uniform layer; it settles over the planet like a layered cake, where the top layer, natural ocean variability, can temporarily hide the greenhouse gas filling.
Natural variability is the slow seesaw of ocean temperatures. The Atlantic Multidecadal Oscillation, for example, makes the North Atlantic warm and cool over decades. El Niño–Southern Oscillation redistributes heat in the Pacific. These oscillations do not add heat from outside; they merely shuffle it between different parts of the planet. But on short stretches of 20–30 years, they can act like a strong wind that either fans a fire or dampens it.
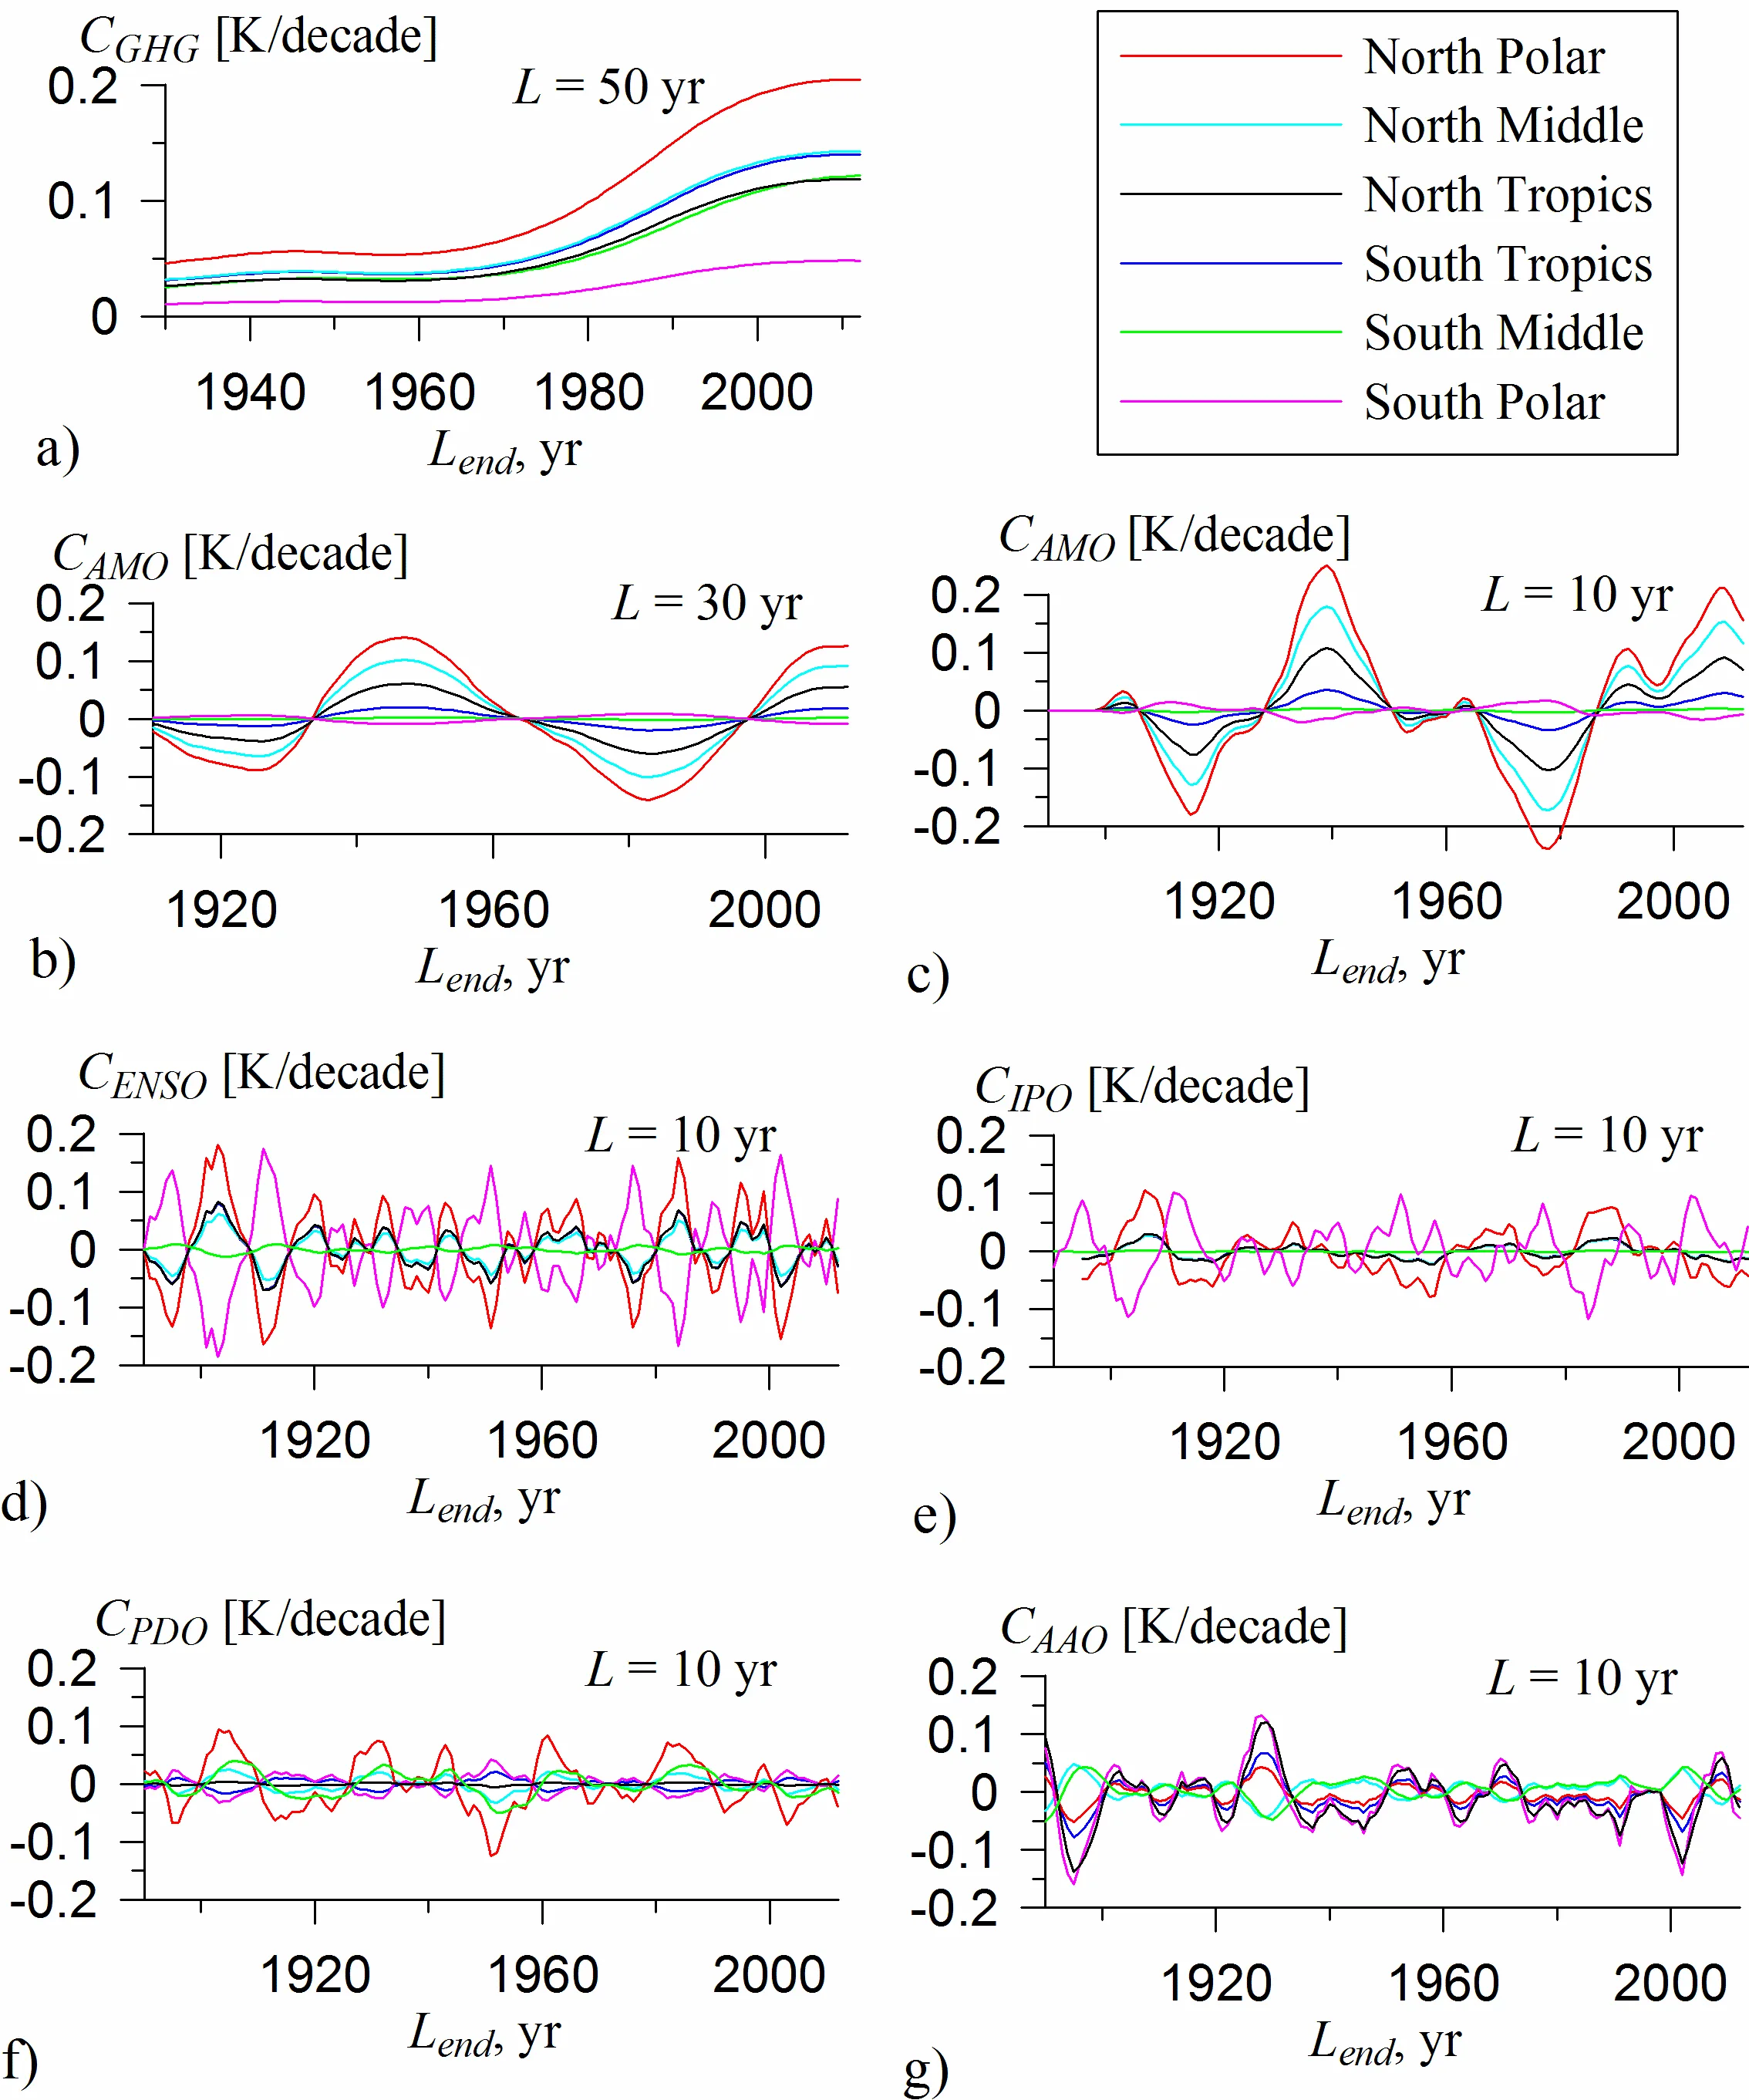
To separate human influence from ocean influence, scientists built a simple model linking temperature in a given year to its value in the previous year, to greenhouse gas levels, and to the phase of ocean oscillations. Then they "switched off" each factor in turn: they replaced the observed greenhouse gas series with an artificial one frozen at 1880 levels, and watched how the slope of the temperature curve changed. This is like tasting a cake layer by layer to see which one gives the dominant flavor.
The result was clear. Over 20–30-year intervals, natural variability can contribute as much as greenhouse gases, and in the Arctic up to 0.2 K per decade or even more. But once you stretch the window to half a century or longer, greenhouse gases dominate at all latitudes. In the last two decades, their contribution reaches 0.2 K per decade. Among natural oscillations in the Northern Hemisphere, the Atlantic Multidecadal Oscillation stands out: over 20-year intervals, its contribution reaches half of the total trend in mid and polar latitudes. In the Southern Hemisphere, the Antarctic Oscillation, which is a seesaw of pressure around Antarctica, plays a role. El Niño affects not only the tropics but also polar latitudes, and in Antarctica the relationship is inverse: when the tropical Pacific warms, Antarctica cools.
This work does not rely on expensive global climate model simulations. Instead, it extracts quantitative estimates directly from observational data using a simple equation. This approach sidesteps the problem of incomplete fidelity in large models and yields statistically reliable estimates of the simultaneous contributions of several factors. The numbers help explain why Antarctic sea ice extent grew in recent decades while Arctic ice shrank rapidly. They also remind us that natural oscillations with periods up to several decades can substantially mask or amplify warming on short horizons, a factor to consider when interpreting short-term climate trends.
Let's return to the room with the radiator. If you watch the thermometer for just a few minutes, you might think the heating is broken: the draft from the window cools the wall. But wait an hour, and the room warms up. So it is with climate: short-term ocean oscillations can be misleading, but over the long haul, the greenhouse gas filling determines the flavor of the whole cake.
The largest contribution of natural fluctuations to temperature trends is found in the Arctic, up to 0.2 K per decade, which is comparable to the greenhouse gas contribution on short intervals. Meanwhile, in Antarctica, the temperature relationship with El Niño has the opposite sign compared to other latitudes: when the tropical Pacific warms, Antarctica cools.