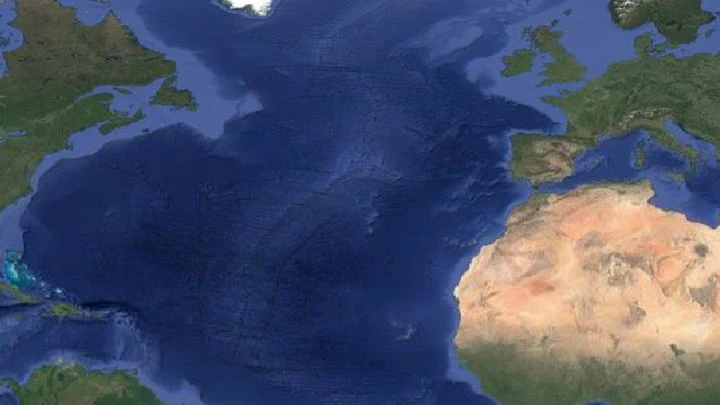
A climatic phenomenon in the North Atlantic Ocean, characterized by fluctuations in the difference of atmospheric pressure at sea level between the Icelandic low and the Azores high.
The NAO is one of the most important drivers of weather variability in the Northern Hemisphere, especially during winter. It affects not only Europe but also eastern North America, influencing temperature, precipitation, storm tracks, and even sea ice extent. Understanding the NAO helps climatologists explain why some winters are harsh and others mild, and it is a key component in seasonal forecasting and long-term climate projections.
History
The phenomenon was first described in the early 20th century by the Danish meteorologist Vilhelm Bjerknes and his colleagues, who noticed the pressure seesaw while studying weather patterns in the North Atlantic. The term 'North Atlantic Oscillation' was coined by the British meteorologist Gilbert Walker in the 1920s, who also identified the Southern Oscillation in the Pacific.
How it works
The NAO arises from the natural internal variability of the atmosphere, driven by the interaction between the jet stream, ocean temperatures, and atmospheric waves. When the pressure gradient between the Icelandic Low and Azores High is strong, the jet stream is more zonal (west-to-east), steering storms across the Atlantic toward northern Europe. When the gradient weakens, the jet stream becomes more meridional (north-south), allowing cold air to spill southward and shifting storm tracks toward the Mediterranean.
In practice
The NAO index, a measure of the pressure difference, is used by meteorologists to predict winter weather patterns in Europe and eastern North America, and by energy companies to anticipate heating demand and by agriculture to plan for precipitation variability.
Fun fact
The NAO can shift from one phase to another within weeks, but its long-term behavior is linked to ocean circulation cycles, such as the Atlantic Multidecadal Oscillation, which can influence the frequency of extreme winters for decades.
Picture a guitar string stretched between two frets. When you pluck it, a standing wave forms: some points on the string oscillate strongly, while others, the nodes, remain almost still. The chromosphere, a layer of the solar atmosphere sandwiched between the photosphere and the corona, behaves in much the same way.
A translator in a conference hall tries to convey the speaker's words, but the hall is noisy: someone coughs, chairs creak, and the street outside is loud. If the speaker lowers their voice, the translator still keeps translating, but their voice drowns in the noise.
A tuning fork produces a pure tone, but if you strike it too hard, it starts to rattle, and a musician might mistake that rattle for complexity in the sound.
In the Pacific Ocean, there is a warm current that flows eastward against all the others. It is called the North Equatorial Countercurrent, or NECC. In normal years, this band of warm water, a few hundred kilometers wide, quietly carries heat from Indonesia toward the Americas.
Deep underground, in the thickness of granite, detectors catch rare visitors from space — muons. These particles are born high in the atmosphere when cosmic rays slam into air nuclei. They make it to the underground lab thanks to their enormous speed, close to the speed of light.
In the Atlantic, a giant invisible conveyor operates: warm surface waters flow north, cool, sink, and return south. This circulation, AMOC, carries heat, making Europe noticeably milder than Canada at the same latitudes. But the conveyor isn't eternal: if diluted by fresh water from melting Greenland ice, the engine stalls.
The ocean does not shout about its intentions. It whispers: a warm patch off the coast of Peru, a cold tongue near Hudson Bay, a barely perceptible shift in a current. The atmosphere does not respond immediately, and by winter Europe may get either mild slush or Siberian frosts.
Ice slips away from under a skate blade like a bar of soap in wet hands. For a hundred years, scientists argued about where this slipperiness comes from. Some said there is already a thin layer of water on top: it acts as a lubricant. Others countered that water only appears when you start moving, due to friction.
A boiling cauldron: steam rises, water churns, and the temperature varies from point to point. So it is in space: the gas clouds around young stars are not smooth spheres but a seething mixture with vortices and density fluctuations. Astronomers long treated such clouds as homogeneous, but this simplification can skew conclusions.
In 1992, Hurricane Andrew tore through Florida, leaving insurers with $$15.5 billion in losses. Many companies went bankrupt, and the market devised a way to shift disaster risk onto investors: catastrophe bonds. These securities pay generous coupons as long as a specified disaster does not occur, such as a hurricane of a certain strength or an earthquake in a particular region.
A warm ocean off the coast of Peru can make winter in Moscow unusually mild. Climate scientists call these invisible threads that link weather in distant corners of the planet teleconnections. For a long time, they were thought of as something like permanent wiring: the signal sources may pulse, but the wires themselves lie still.
An orchestra of a hundred musicians plays without a conductor. As long as the score is familiar, each player confidently follows their part, and together they sound harmonious. But when the composer changes the rhythm, discord creeps in: some instruments keep playing the old tune, others try to adapt, and a few fall silent.
The climate of the United States is not a straight line creeping upward. It is an orchestra without a conductor, where every violin and every drum plays its own part, and together they create an intricate pattern of warm and cold, wet and dry years.
A camera on a tripod shoots the same landscape for decades. If you don't touch the lens, the images get hazy: the landscape changes, but the focus stays put. That's roughly how climate norms work. According to World Meteorological Organization rules, they are calculated as the average over the last 30 years.
Imagine an orchestra playing without a conductor. Each section takes its turn: first the winds introduce the theme, then the strings join in, and sometimes an unexpected percussionist solos.
Imagine an interpreter in a huge hall who hears not only the person next to them but also a whisper in the far corner, and from those fragments reconstructs the entire conversation. That's how the CAS-Canglong neural network works: it picks up connections between pressure, wind, and heat across the whole planet and uses them to predict what the ocean will look like three months from now.
Two dancers stand facing each other but cannot see each other's faces. One is the atmosphere, fast and noisy, forgetting its moves after just a couple of weeks. The other is the ocean, slow and heavy, remembering every touch for months. For the dance to work, they need to learn to lead each other while only looking at their partner's hands.
Climate is like an orchestra without a conductor: each musician hears the others with a delay, and the score changes mid-concert. The ocean, atmosphere, ice, and land continuously exchange energy, and the slightest hiccup in one instrument can escalate into a shift of the entire melody.
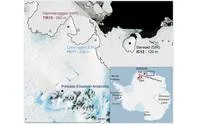
On the coast of Dronning Maud Land, two ice cores stand like two seismographs on one shore. One, FK17, was drilled on the crest of the Lokenryggen ice rise; the other, TIR18, on the crest of Hammaryggen. A hundred kilometers apart, they catch different tremors of the climate. One hears the Pacific, the other the Atlantic and Indian Oceans.
In the summer of 2022, the sky over western India seemed to have forgotten about drought: rains fell more often than usual, while eastern states languished in dryness. Such an imbalance puzzled forecasters, because ocean currents in the Pacific had promised a steady, abundant monsoon across the country.
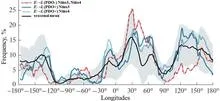
Every few years, the Pacific Ocean changes its character. Sometimes it warms up off the coast of South America, which is called El Niño, and sometimes it cools down, bringing La Niña. For someone on the other side of the planet, this is not just a weather report item. The ocean acts as a conductor, setting the tempo for heat and drought over Eurasia.
The Atacama Desert in northern Chile is the driest non-polar place on Earth. The sky is almost always clear, and the air is so devoid of moisture that even distant galaxies are visible without interference.
Picture an orchestra where each instrument plays at its own tempo: violins speed up, woodwinds slow down, and percussion keeps losing the beat. That's roughly what Earth's climate looks like, with the ocean, the Sun, volcanoes, and human activity pulling temperature in different directions.
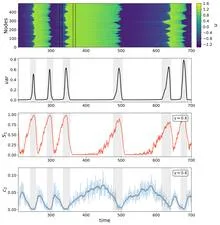
A fisherman pulls on his net and listens to it ring. Each strand quivers in its own way, but before a strong tug, all the strands begin to vibrate in unison. So it is with complex systems: before a sharp state jump, the individual parts suddenly start to oscillate in concert, and that synchrony betrays the coming jump.
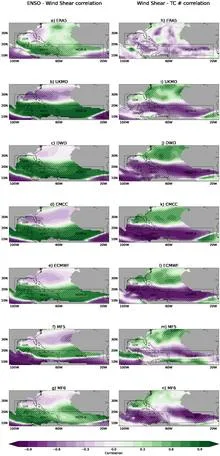
Over the warm waters of the Atlantic, air begins to swirl like water spiraling down a drain. That is a future hurricane, and its fate depends on what happens thousands of kilometers away in the Pacific Ocean. When the El Niño current warms up there, storms in the Atlantic become fewer. The models that forecast hurricane season know about this link.
A conductor in a concert hall waves a single baton, yet violins and timpani respond differently. Likewise, the warm patch in the Pacific Ocean known as El Niño makes different corners of Russia experience completely different winters under the same phase. Somewhere snow melts in January, while elsewhere frosts intensify to the limit.
Warm air rises from a radiator, and the room seems to heat evenly. But if you put your hand against the wall by the window, it feels cooler than by the door.
In 1960, a meteorologist at a station in Peru records water temperature, while a farmer in India watches the sky waiting for the monsoon. There is no direct link between these two events, but months later one will echo in the other.
The ocean off the coast of Peru warms and cools, and with it the whole planet runs a fever: rains flood deserts, and tropical forests dry out. This is El Niño, the most noticeable climate oscillation after the changing seasons. For half a century, it has been described by a single number: the water temperature in a small square of ocean.
In 2021, two tools designed to forecast weather a year ahead showed different results. One, built on connections between temperatures at different points in the Pacific Ocean, was silent: no El Niño in 2022.
A translator who learned a language from thousands of books can interpret a conversation without being distracted by noise in the hall. Similarly, a neural network trained on 127,137 years of model climate produces a winter forecast in a fraction of a second, faster and more accurately than bulky dynamical systems.
A farmer in Iowa looks at the calendar: plant now or wait? In a month, a heat wave might strike, or rain might set in. Forecasters throw up their hands: the two-week forecast still holds, the seasonal one is out of reach, and in between lies a gap. The atmosphere changes too quickly to remember yesterday, and the ocean is too slow to come to the rescue.
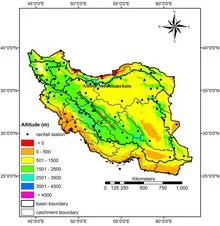
In 2019, northern and southwestern Iran received 50% more rainfall than usual, and rivers overflowed their banks. A year earlier, in 2018, rainfall was 53% below normal, and fields cracked under drought. Such swings are not random; they are responses to three distant oceanic pulses that set the rhythm for Iran's rains.
Winning the lottery changes the winner's life, but for the statistics of all players it means almost nothing: the probability of winning is negligible, and the average winnings per ticket remain tiny.
Imagine a map where each patch of ocean is colored with its own shade: in some places the color is saturated, meaning the future of the system is predetermined; in others it is pale, meaning the outcome depends on a random gust of wind.
On a playground, two swings stand side by side. One child pumps on their own, while the other barely moves until the first gives a push with their foot. Something similar happens in the tropical Pacific and Indian Oceans, except instead of children, there are warm and cold masses of water.
Every spring, the sky over the US Great Plains starts behaving like a giant steam boiler. Warm, moist air from the Gulf of Mexico collides with dry air from the west, and in that mix, thunderstorms are born that can rip the roof off a barn in minutes. Meteorologists have long tracked the 'fuel' for such storms, but so far they have mostly looked at average values.
A warm tongue of water stretches along the equatorial Pacific, and within weeks, Peru sees torrential rains while Australia's pastures dry out. That is how El Niño begins: a natural conductor that, at critical moments, makes only a few orchestra members play, but much louder.
In a climate trial, the judge doesn't listen to who shouts loudest. He watches who whispers to whom. Nine witnesses, from carbon dioxide to cosmic rays, testified from 1984 to 2005. Their statements were recorded every month. The judge doesn't trust mere coincidences, because two witnesses might echo each other without knowing who started first.
On April 16, 2012, Washington experienced heat no one expected. The thermometer climbed 18 degrees above normal. Sixty days earlier, Bucharest and Kyiv had weather unusual for them. The link between these events was found by an algorithm that scans pairs of cities worldwide, looking for recurring coincidences.