Climate as a Layered Cake: How Much Heat Comes from Humans and How Much from the Ocean
Context
The question of how strongly natural fluctuations of the climate system mask or amplify anthropogenic warming remains one of the most pressing in modern climatology. The observed rise in global surface temperature since the 19th century includes periods of acceleration and slowdown, including the so-called 'pause' in global warming at the beginning of the 21st century. Alongside this work in the archive are studies that attempt to separate weather noise from climate signal, assess the memory of ice sheets, and understand the climatic seesaw of ancient Mars. This article stands somewhat apart: it does not build a complex general circulation model but extracts quantitative estimates of contributions directly from empirical data using a minimalist stochastic model. This approach avoids a priori assumptions about parameterizations and yields statistically reliable estimates of the simultaneous contributions of several factors to temperature trends at different latitudes.
Methods
The authors used a simple first-order three-dimensional autoregressive model in which the temperature anomaly in a given year depends on its value in the previous year, the current radiative forcing from greenhouse gases, and the index of one of the natural variability modes (AMO, ENSO, PDO, IPO, or AAO). The model was fitted to observational data from 1880 to 2012 using least squares. To estimate the contribution of each factor to the trend, the authors 'switched off' that factor by replacing its observed time series with an artificially generated one (for example, holding greenhouse gas forcing at the 1880 level) and compared the model temperature trend with the actual one. The difference in trends gave the sought contribution. This technique is analogous to asking: 'How much would the slope of the temperature curve change if the ocean behaved differently?' To test the robustness of the results, models with longer time lags (up to 30 years) and higher autoregressive orders (up to five) were also used; the conclusions about the maximum contribution values were similar.
Results
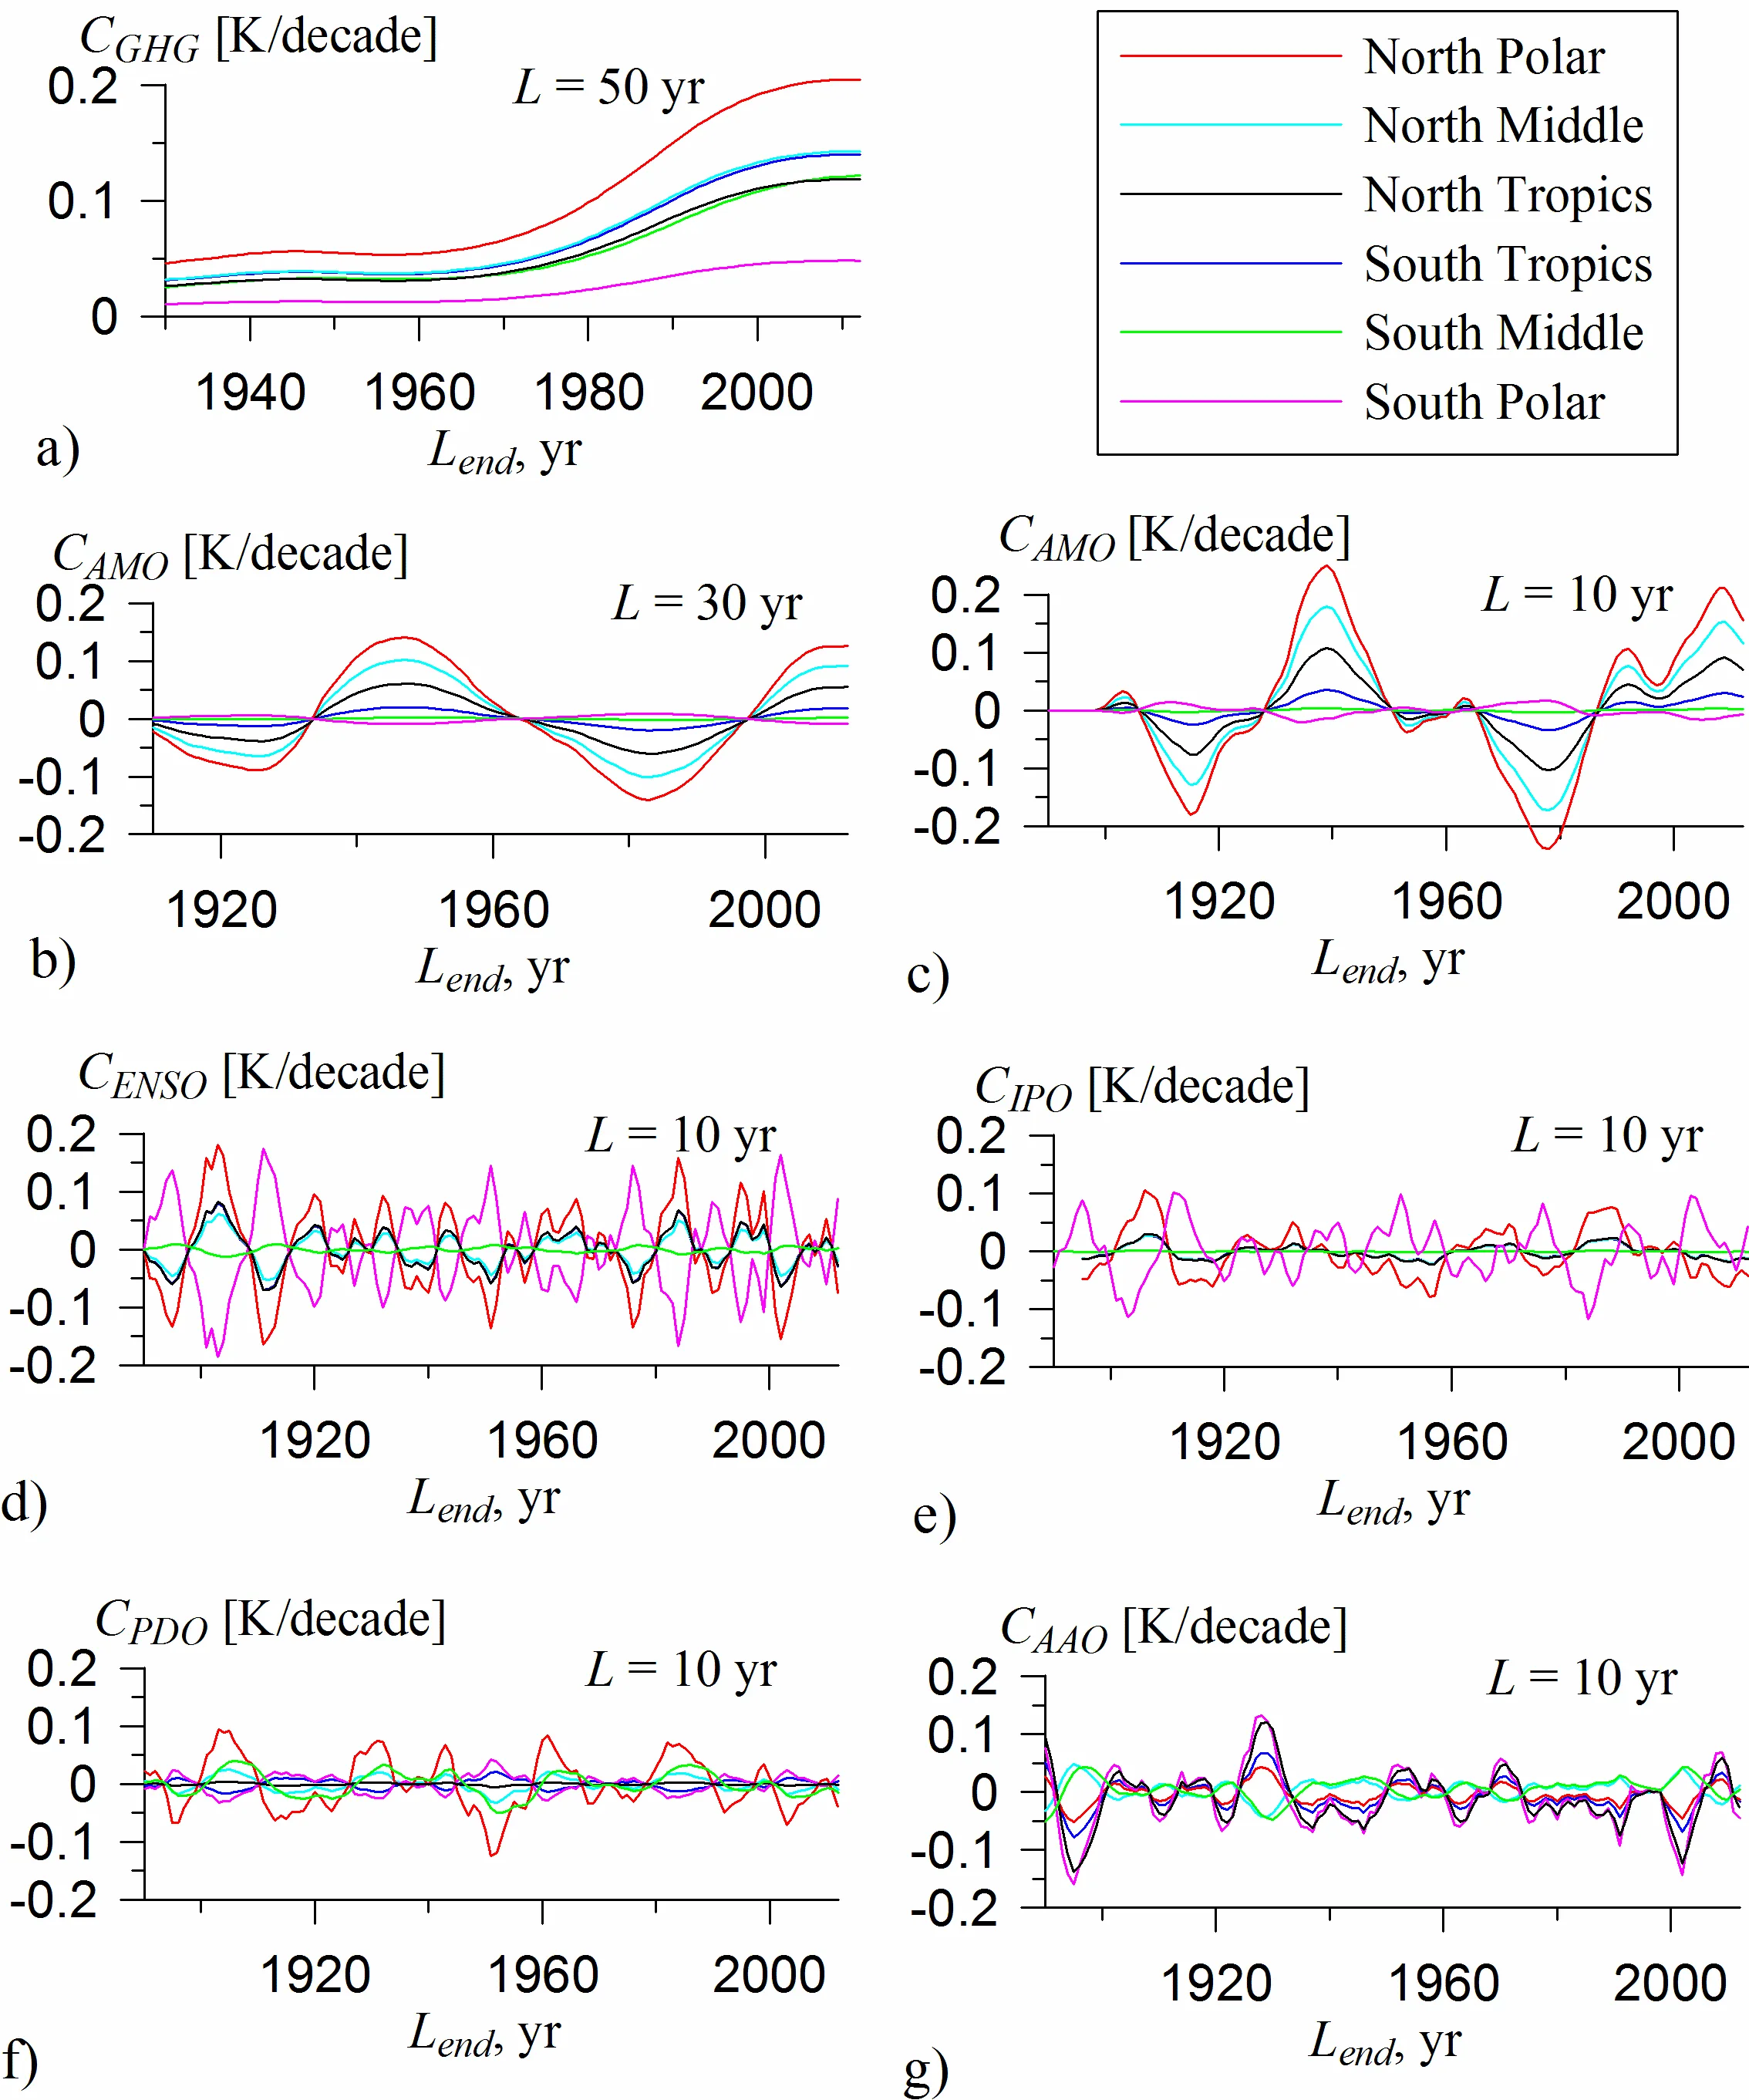
On intervals of 20–30 years, contributions from natural variability modes can reach ±0.2 K per decade and be comparable to the greenhouse gas contribution, sometimes exceeding it. The largest contributions are found in Arctic latitudes, where they reach 0.2 K per decade or more. On intervals of half a century or longer, the greenhouse gas contribution dominates at all latitudes: the ratio of the greenhouse gas contribution to the total trend exceeds 0.5 for all latitude bands, except for short windows of 20–30 years in extratropical latitudes. In the last two decades, the greenhouse gas contribution reaches 0.2 K per decade and even slightly exceeds this value. Among natural modes, the most notable contribution in the Northern Hemisphere comes from the Atlantic Multidecadal Oscillation (AMO): on 20-year intervals, its relative contribution reaches 0.5 in mid and polar latitudes. In the Southern Hemisphere, the Antarctic Oscillation (AAO) shows a noticeable contribution on 20–30 year timescales, although its statistical significance is low. El Niño–Southern Oscillation (ENSO) contributes significantly not only in the tropics but also in polar latitudes, with the sign of the relationship in Antarctica being opposite to that in other latitudes.
Implications
This work differs from neighboring studies in that it estimates factor contributions to temperature trends not through expensive ensemble calculations with general circulation models, but through a simple empirical model whose parameters are entirely determined by observational data. This provides statistically more reliable estimates of the simultaneous contributions of several factors and bypasses the problem of incomplete adequacy of large models. The obtained quantitative estimates are important for explaining regional differences in current trends, particularly for understanding why Antarctic sea ice extent has grown in recent decades while Arctic ice has rapidly declined. The work also emphasizes that natural variability with periods of up to several decades can substantially mask or amplify the anthropogenic signal on short time horizons, which must be taken into account when interpreting short-term climate trends and when validating climate models.
Future development
The proposed approach can be extended by including several natural variability modes simultaneously in the model, as well as nonlinear interactions between them and the anthropogenic factor. It is also promising to apply more sophisticated empirical models with time-varying coefficients that could capture changes in climate sensitivity over time. Another direction is to use longer paleoclimate reconstruction records to test how stable the obtained contribution estimates are on centennial scales. It is also important to conduct a similar analysis for other climate variables, such as precipitation or sea-level pressure, to understand how natural variability modulates regional trends not only in temperature but also in the hydrological cycle.
Impact
The results are useful for specialists in climate change detection and attribution, as they provide quantitative benchmarks for the contributions of natural modes to temperature trends that are independent of general circulation models. They are also important for climate model developers, who need to adequately reproduce natural variability to correctly project regional climate changes.
Next steps
The immediate next step is to conduct similar estimates using newer versions of temperature and variability index data, as well as to expand the set of natural modes to include, for example, the North Atlantic Oscillation. It is also worth checking how robust the conclusions are to the choice of a specific index for each mode and to the method of data filtering.
Key open problems
This work is directly related to the fundamental problem of separating the anthropogenic signal from natural internal variability in the climate system. It shows that on timescales of several decades, natural fluctuations can completely mask the anthropogenic trend, which creates difficulties for detecting and attributing climate change. Furthermore, the results highlight the need for more accurate modeling of natural variability modes in climate models, since their inadequate reproduction can lead to systematic errors in regional climate projections.
The largest contribution of natural fluctuations to temperature trends is found in the Arctic, up to 0.2 K per decade, which is comparable to the greenhouse gas contribution on short intervals. Meanwhile, in Antarctica, the temperature relationship with El Niño has the opposite sign compared to other latitudes: when the tropical Pacific warms, Antarctica cools.
Key numbers
- maximum contribution of natural modes: ±0.2 K per decade
- greenhouse gas contribution in the last two decades: 0.2 K per decade
- threshold for greenhouse gas dominance: about 50 years
- observation period: 1880–2012
- characteristic relaxation time for mid-latitudes of the Southern Hemisphere: about 5 years