A Council of Elders Instead of a Popular Vote: How to Pick the Best El Niño Forecasts ✛
In a room with 80 advisors, each shouts their own opinion, and if you simply listen to everyone and take the average, you get mush. So it is with El Niño forecasts: a model produces 80 possible futures, but not all are equally useful. Some err less often, others more, and still others talk about something else entirely. Usually forecasters average all 80 with weights based on overall accuracy, but that is like giving the floor to both a sage and a blabbermouth.
The authors of the new study took a different approach: they built a graph where each forecast is a node, and a line between nodes means that two forecasts are similar in error and in how synchronously their values change. The result is a network where some forecasts stick together like a tight-knit group of like-minded people, while others are scattered at the edges. Then an algorithm identified communities: groups of nodes that are closely connected.
These 20 forecasts are not just more accurate individually: they have less spread of error across different lead times, smoother transitions between El Niño and La Niña phases, and they are more tightly connected in the graph. At lead times up to 23 months, the correlation with reality stayed above 0.4, and the improvement over the original model was about 10%. This is especially noticeable after 2000, when the climate became more variable.
Previously, it was unclear how to select truly reliable forecasts from the 80, rather than simply averaging them all with weights. Now it is clear: a consistent core of 20 forecasts, found via the similarity graph, provides a more stable and accurate El Niño forecast up to two years ahead. The method does not train a new model; it brings order to an existing ensemble.
In the end, the room with 80 advisors turns into a small council of elders: less noise, more agreement, and the forecast for two years ahead sounds more confident. The graph does not predict on its own, but it helps you hear those who truly know.
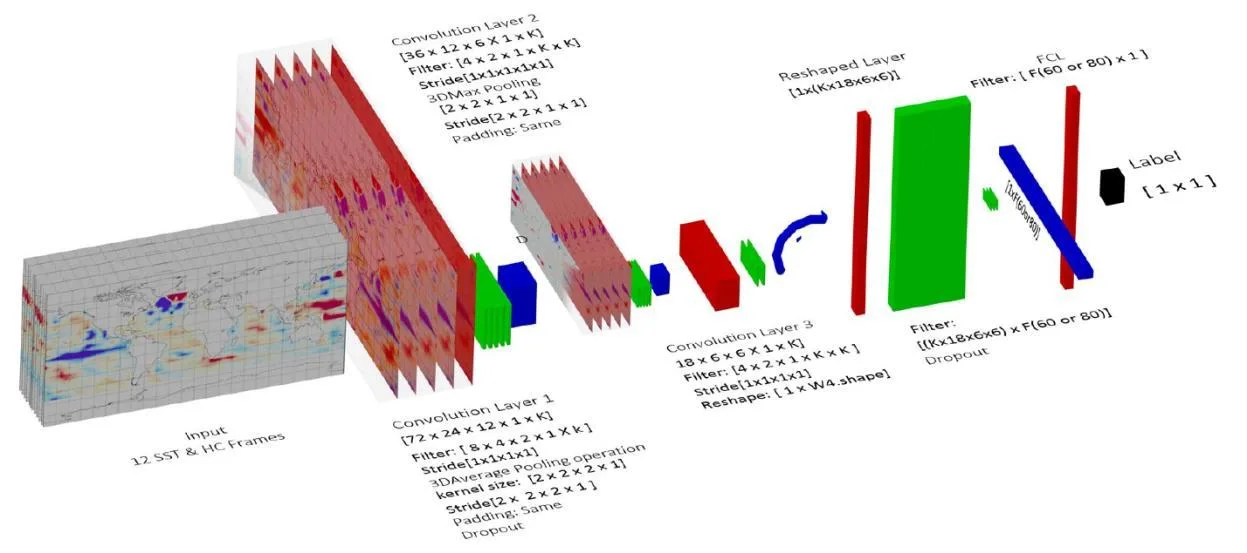
The model was trained on data from 1875 to 1975 and tested on 2000–2017. Between these periods lies a quarter century that the model never saw. This gap was deliberately left to avoid the ocean memory effect and to test whether the forecast works under completely different conditions.