A graph instead of weights: how to pick the best El Niño forecasts ✛
Context
This work sits alongside studies where neural networks are already being used to enhance El Niño forecasts: some learn on graphs, others pick up signals in weak lensing or detector noise. Here the task is different: not to train a new model, but to make sense of an existing ensemble of 80 forecasts. Previously, these were simply averaged with weights based on the overall accuracy of the modules, without considering how similar individual forecasts are to each other. The authors introduce a graph structure that makes the similarity between forecasts explicit, allowing them to filter out noise and retain a consistent core.
Methods
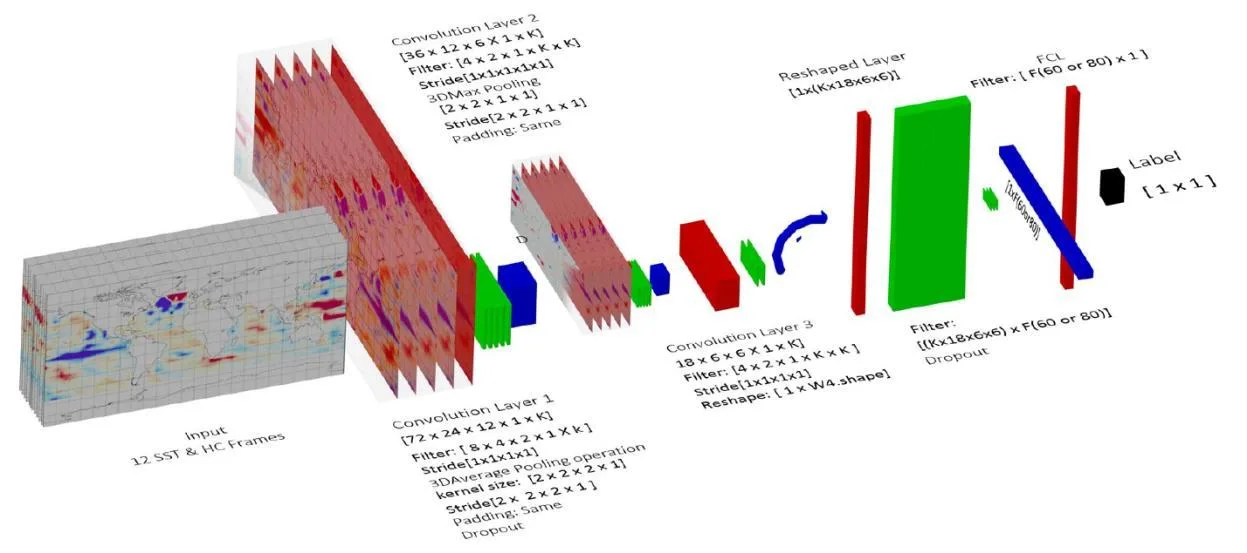
First, the MEF model produces 80 forecasts: 40 from a 3D convolutional network that processes ocean temperature anomaly maps as videos, and 40 from the time-series module. Each forecast then becomes a node in an undirected weighted graph. The weight of an edge between two forecasts is computed from their similarity, using mean squared error and Pearson correlation. Node features include error and smoothness of the time series. A graph algorithm then identifies communities, groups of forecasts that behave similarly. From the densest and most accurate community, 20 forecasts are selected and averaged. Computations were run on NVIDIA Tesla A100 GPUs in Google Colab, using about a terabyte of data from 21 CMIP5 models and GODAS observations.
Results
Graph-based selection improved forecast correlation by about 10% compared to the original MEF model, especially at leads longer than a year. For all leads from 1 to 23 months, correlation remained above 0.4, and at 23 months the model captured nearly half of all El Niño and La Niña events. The selected 20 forecasts were not just individually more accurate: they had less error spread across different leads, smoother transitions between phases, and denser connectivity in the graph. The graph approach does not always beat the baseline MEF in every single scenario, but it yields more stable and consistent results, especially in challenging cases with long lead times.
Implications
Unlike neighboring works where graph neural networks learn to predict or improve individual models, here the graph is used as a meta-tool: it does not make predictions but brings order to an existing ensemble. This is the first test that structural similarity between forecasts can serve as a noise filter without modifying the model itself. The approach is model-agnostic and transferable to any ensemble system, from dynamical climate models to hybrid statistical schemes.
Future development
Graph-based ensemble analysis could become a standard post-processing step in seasonal and subseasonal forecasting. If we can quickly build similarity graphs for thousands of ensemble members, selecting a consistent core would become routine. Further work could explore different similarity measures: dynamic time warping, cosine distance, entropy-based features. A separate question is why the selected forecasts form a dense community and what physical mechanisms underlie this.
Impact
The method applies to any system that produces many forecasts, from climate models to financial or epidemiological ensembles. In operational El Niño forecasting, it could enhance the reliability of warnings about droughts, floods, and heatwaves months in advance.
Next steps
Test the method on other ensemble systems, such as C3S dynamical models or subseasonal forecasts. Investigate how the choice of similarity measure and community size affects selection quality.
Key open problems
This work addresses a long-standing problem in climatology: the spring predictability barrier, where model skill drops sharply when crossing spring. Graph-based selection does not remove the barrier entirely, but it makes forecasts more robust at long leads, where classical methods degrade. It is a step toward understanding how to extract signal from a noisy ensemble under increasing climate variability after 2000.
The knowledge machine's view
This section is addressed to the author of the paper and their colleagues. Neighbouring works were found by meaning-based search across our archive, not by word overlap. We do not review: we show the field around the work.
What the work does
The authors took an ensemble of 80 forecasts from the MEF model (40 from a 3D convolutional network, 40 from a time-series module), built a graph where nodes are forecasts and edges represent their similarity in error and correlation, then identified communities and selected the 20 most consistent and accurate forecasts. Averaging this core improved correlation by about 10% at long horizons and kept skill above 0.4 for all lead times up to 23 months.
Where its strength is
The work introduces a graph as a meta-tool for filtering noise in an existing ensemble without changing the model itself. This approach is model-agnostic and transferable to other ensemble systems.
Where it could go next
- It might be interesting to see how graph-based selection behaves on other ensemble El Niño forecasts, for example, in a study where a neural network predicts El Niño 1.5 years ahead. Transferring the method to their ensemble would test the universality of the approach.based on: El Niño Can Be Predicted a Year and a Half in Advance arXiv:2601.12251
- Related work on weather forecasting using a single GPU employs an efficient architecture. One could try combining graph-based selection with their fast model to gain both speed and ensemble quality.based on: Weather forecast on a single GPU arXiv:2603.21284
- In the archive, there is a paper on network compression where roads become points, also involving selection of elements based on their connectivity. Perhaps their node importance metrics could help improve community detection in the forecast graph.based on: Compressing networks: when roads become points arXiv:2607.14834
Worth trying
- Try other similarity metrics between forecasts, such as dynamic correlation or distance in state space.
- Check how the result depends on the size of the selected core (not only 20 out of 80).
- Apply graph-based selection to an ensemble of different models (CMIP5 and observations), not just forecasts from a single model.
Why this may matter
If graph-based selection consistently improves long-term El Niño forecasts, it could become a standard post-processing step for ensembles in climate modeling, increasing the reliability of extreme event predictions.
Nearby works in our archive
- El Niño Can Be Predicted a Year and a Half in Advancesimilarity 0.49
- A neural network that senses stress in parts of any shapesimilarity 0.49
- Neural Network Learns to Read Molecules by Their Carbon Signaturesimilarity 0.49
- Weather forecast on a single GPUsimilarity 0.47
- Neural Network Sculptor: Reading a Gravitational Lens from Four Pointssimilarity 0.47
- SpecFANN: Lightning-Fast Sketch of a Star's Spectrumsimilarity 0.47
- Compressing networks: when roads become pointssimilarity 0.46
The archive is sparse around this work: the closest review is only 0.49, against a usual 0.64. It looks like few have drilled nearby.
The model was trained on data from 1875 to 1975 and tested on 2000–2017. Between these periods lies a quarter century that the model never saw. This gap was deliberately left to avoid the ocean memory effect and to test whether the forecast works under completely different conditions.
Key numbers
- total ensemble members: 80
- selected forecasts: 20
- forecast horizon: up to 23 months
- correlation at all leads: above 0.4
- correlation improvement: about 10%