An ensemble average is the average of a physical quantity over a large collection of identically prepared systems, called an ensemble. In statistical mechanics, it replaces the time average of a single system over a long period, under the ergodic hypothesis that the two are equal. This concept is central to connecting microscopic dynamics to macroscopic thermodynamic properties like temperature, pressure, and entropy.
History
The concept of the ensemble was introduced by Josiah Willard Gibbs in his 1902 book 'Elementary Principles in Statistical Mechanics', building on earlier work by Ludwig Boltzmann and James Clerk Maxwell. Gibbs's formulation provided a rigorous foundation for statistical mechanics.
How it works
Given a probability distribution ρ over the possible microstates of a system, the ensemble average of an observable A is ⟨A⟩ = ∫ A(x) ρ(x) dx (or a sum for discrete states). Different ensembles correspond to different physical constraints: the microcanonical ensemble fixes energy, the canonical ensemble fixes temperature, and the grand canonical ensemble fixes temperature and chemical potential. The average is then computed by weighting each microstate by its probability according to the ensemble's distribution.
In practice
Ensemble averages are used in molecular dynamics simulations to compute material properties, in Monte Carlo methods for statistical physics, and in machine learning for estimating expected values from data distributions.
Fun fact
In quantum statistical mechanics, the ensemble average of an observable is computed as the trace of the product of the density matrix and the observable, linking the trace operator to this concept.
A numerical factor that depends on the frequency integration limits and the specific definition of 'average' (e.g., over the full spectrum). — proportionality constant = 2.701
k_B
constant
Fundamental constant converting temperature to energy scale — boltzmann constant= 1.380649e-23joule per kelvin
⟨ ⟩
operator
Statistical average over the photon distribution — ensemble average
$$C_{l m l' m'} = \langle a_{l m} a^*_{l' m'} \rangle$$
Defines correlation coefficients of spherical harmonic coefficients.
What is in the formula
C_{lm l'm'}
variable
Angular power spectrum coefficients — angular power spectrum
a_{lm}
variable
Spherical harmonic coefficients of temperature map — spherical harmonic coefficient kelvin
Picture a flock of birds gathering around a feeder that no one built. Each bird searches for food on its own, yet they all end up together. Usually, such behavior is explained by social instinct: birds want to be near their kin. But what if the flock is simply a side effect of greed?
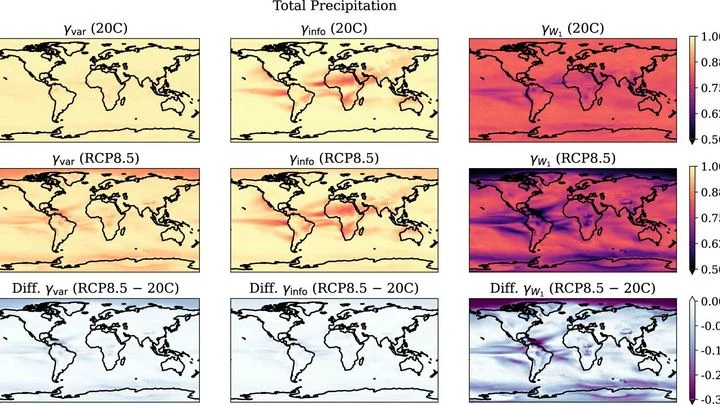
In winter, one part of town gets three times as much snow as the neighborhood next door. One year is a scorcher, the next is a cold snap. That's the whims of weather. But over decades, a different, slow shift emerges: winters, on average, get milder. Telling the two apart is the central challenge for climate scientists.
Water droplets shoot out of a nozzle one after another, like cyclists on a narrow track. The faster ones catch up with the slower ones and merge into larger drops. This simple mechanism is called ballistic aggregation, and until now it had only been observed on cosmic scales: this is how dust particles stick together to form planets.
Usually, the complexity of systems, from satellite motions to heart rhythms, is assessed with averaged entropy (a measure of unpredictability, as understood by Boltzmann). But that's like evaluating the ocean only by wave height: the average figure hides the full richness of underwater currents.
Gravitational signals from dying massive stars are whispers reaching us from the most violent laboratories in the Universe. Einstein predicted these gravitational waves over a century ago, but only today, with detectors like LIGO, are we beginning to hear them.
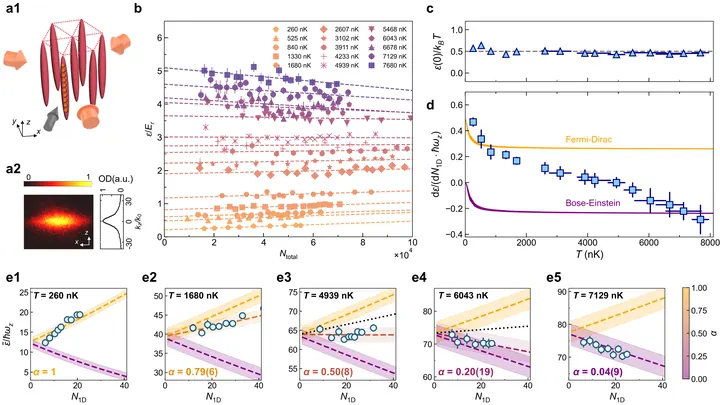
Textbooks divide particles into two camps: bosons love to crowd into the same state, fermions absolutely refuse. But nature allows a third option. Anyons are quasiparticles whose behavior lies somewhere in between. They can 'remember' how they were exchanged and obey a nonstandard exclusion principle.
A busy intersection without traffic lights. Cars drive, brake, and change lanes, and from the outside, it looks like complete chaos. But if you watch for a while, you can notice a rhythm: the flow thickens and thins. In physics, this rhythm of disorder is called entropy: it shows how far a system is from calm equilibrium, like water in a boiling kettle.
When a person breathes, air doesn't flow in a steady stream but in waves. Previously, doctors and scientists only looked at overall numbers: how much air entered per breath, what the peak flow was. But within a single breath, there are nuances — small variations that speak to the workings of nerves and muscles. The new approach breaks a breath into parts, much like a musician breaks a chord into individual notes.
The heart beats steadily, then slips into arrhythmia. The climate holds its familiar rhythm for decades, then shifts to a new state over a single summer. Such regime shifts are like a flick of a switch, but in real data we see only a noisy one-dimensional signal in which the moment of the break is hidden.
Water can be ice, liquid, or steam. Physicists call these states phases. In theory, each phase has its own measure — a way to describe how likely it is. But not every measure you can imagine occurs in nature. Some phases are real, while others are just mathematical illusions.
Scientists have found a simple criterion that separates reality from mirage.
In an orchestra where every musician plays the same note, the sound merges into a powerful unison. This is how a Bose–Einstein condensate is born: many boson particles at extremely low temperatures behave as a single entity.
A film of a shattered cup played backward looks absurd: shards don't spontaneously reassemble. This intuitive sense of irreversibility is tied to the increase of entropy — a measure of disorder in a system. The second law of thermodynamics states that the entropy of an isolated system never decreases, setting time's direction from past to future.
Thousands of models simmer in a single cauldron, and the steam rises thick and impenetrable. Each whispers something about the future of El Niño, but in the general din you cannot tell who is right and who is just boiling over.
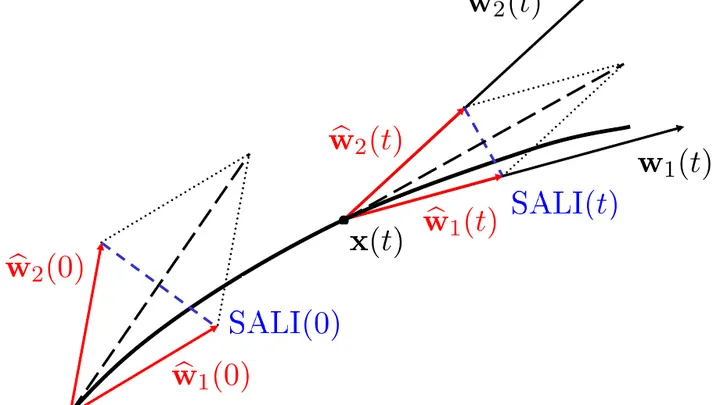
Drop a stone into a calm pond — the ripples spread evenly. Drop it into a churning stream — the water swirls unpredictably. Scientists have long wrestled with a similar question: how can you tell from a single particle's path whether its motion is chaotic? Previously, this meant comparing the particle's path with neighboring ones, which is complicated and time-consuming.
In a room with 80 advisors, each shouts their own opinion, and if you simply listen to everyone and take the average, you get mush. So it is with El Niño forecasts: a model produces 80 possible futures, but not all are equally useful. Some err less often, others more, and still others talk about something else entirely.
In February 2022, the eastern coast of Australia was hit by rains that lasted several days in a row. Water inundated towns in Queensland and New South Wales, insurers paid out 3.35 billion dollars, and the flood became the costliest in the country's history.
On April 16, 2012, Washington experienced heat no one expected. The thermometer climbed 18 degrees above normal. Sixty days earlier, Bucharest and Kyiv had weather unusual for them. The link between these events was found by an algorithm that scans pairs of cities worldwide, looking for recurring coincidences.