Climate as an Orchestra Without a Conductor: Rhythms Over Trends ✛
The climate of the United States is not a straight line creeping upward. It is an orchestra without a conductor, where every violin and every drum plays its own part, and together they create an intricate pattern of warm and cold, wet and dry years. Thomas Xiao took a 130-year recording of this orchestra, monthly NOAA data on temperature, precipitation, and drought, and broke it down into individual notes.
It turns out that the score has two main motifs. The first is the annual cycle: summer is always warmer than winter. The second is the slow breathing of the ocean with a period of two to seven years, which we know as El Niño. These rhythms explain climate variability better than a monotonic trend. A model that hears these notes predicts the future with lower error than one that simply draws a straight line.
But the orchestra does not always play from the same score. The PELT method, which searches for abrupt regime shifts, found two moments when the music changed. In the 1930s, the Dust Bowl arrived, and in 1976–1977, a Pacific shift occurred, as if a conductor suddenly changed the tempo.
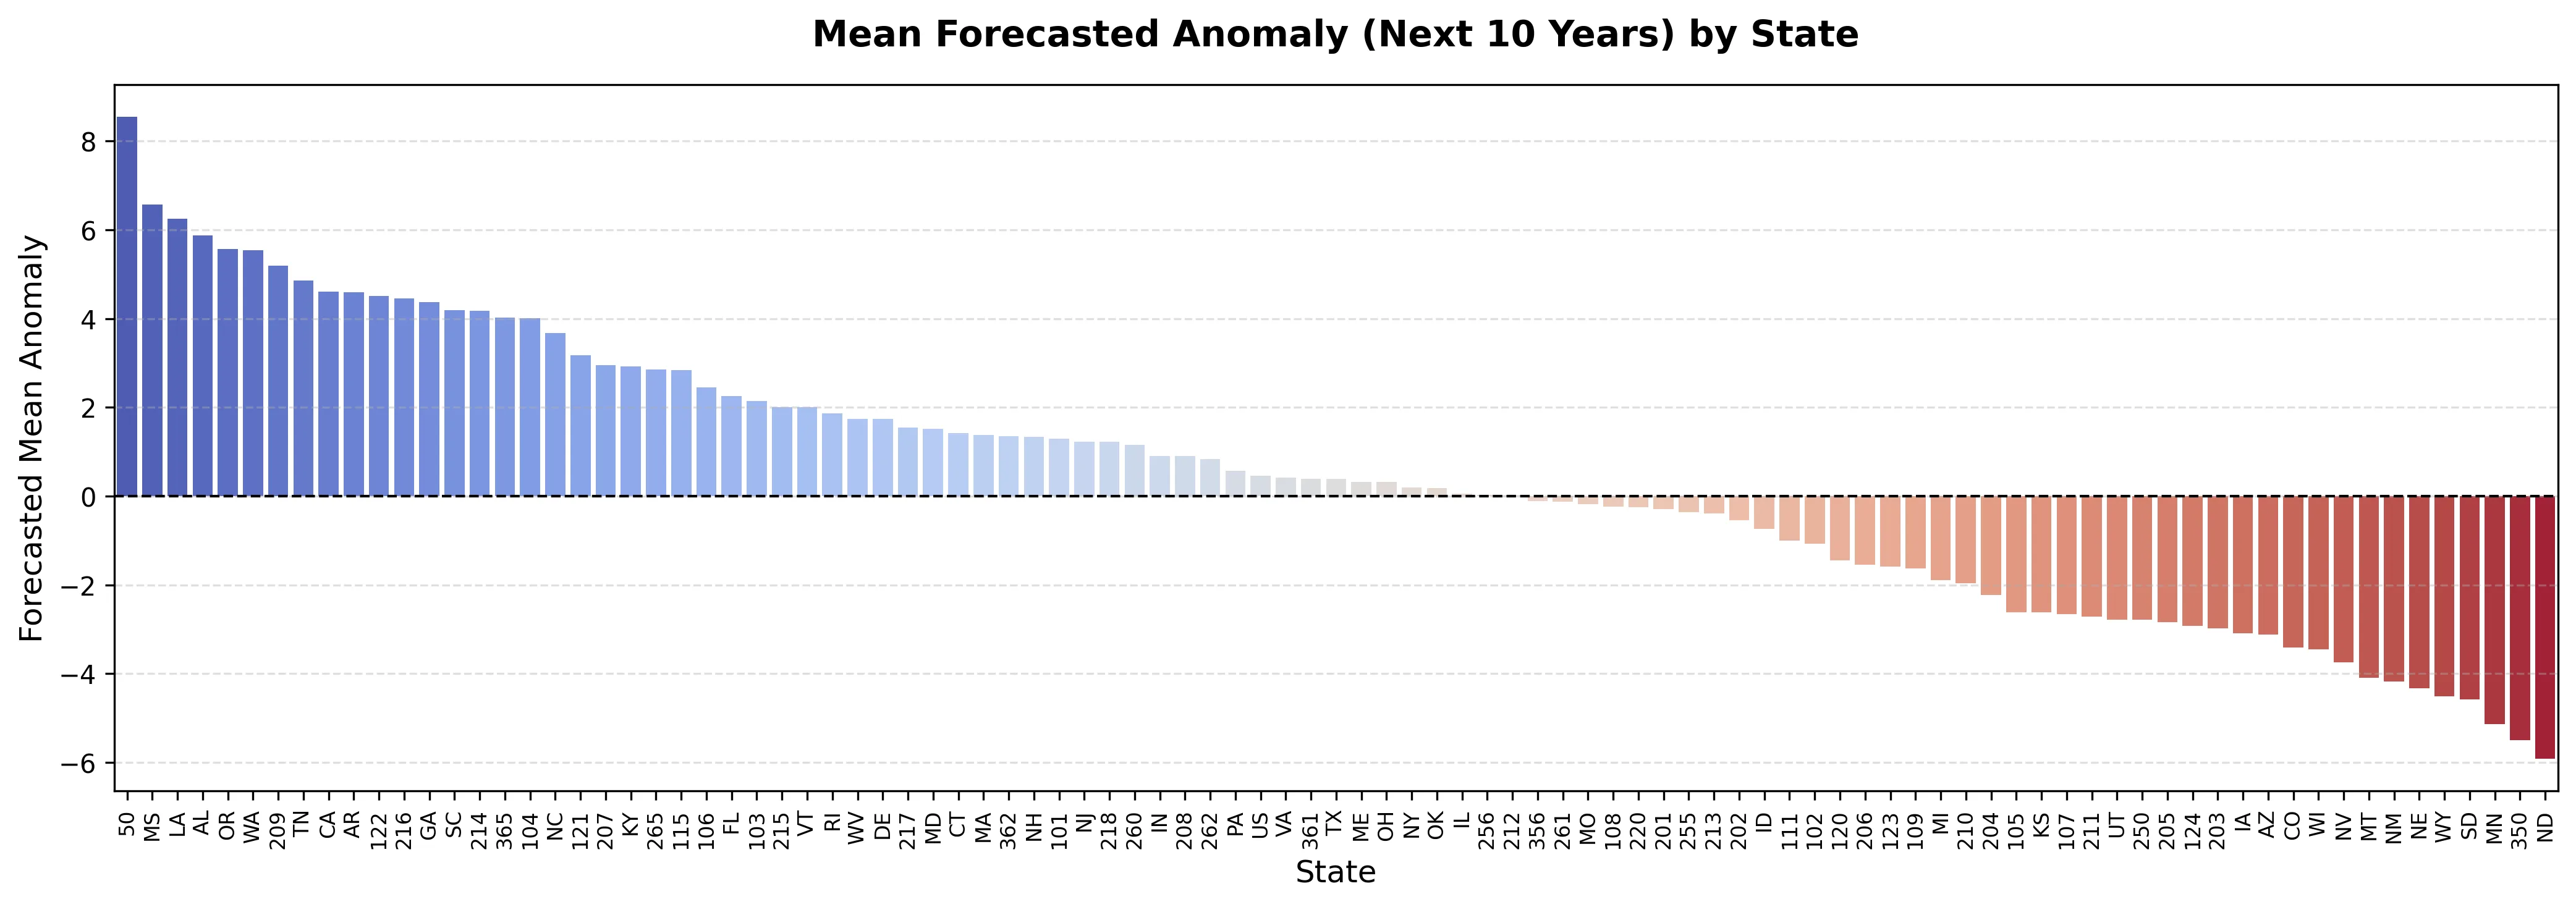
For 2026–2035, the forecast is centered near zero with a slight positive bias. This suggests a possible increase in precipitation variability: the Gulf Coast and the Pacific Northwest will become wetter, while the northern Great Plains will dry slightly. But the main takeaway is not specific numbers but that climate is not just a trend; it is a superposition of rhythms. And if we want to understand the future, we must listen not only to the volume but also to the melody.
The precipitation spectrum peak at 3 cycles per year means that the strongest precipitation fluctuations in the U.S. occur with a period of about 4 months, not once a year as one might expect. This is because the seasonal cycle was already removed when calculating anomalies, leaving faster modes, such as those related to intraseasonal processes.
The idea of predicting climate through hidden rhythms echoes Isaac Asimov's 'Foundation', where Hari Seldon's psychohistory uncovers cyclical patterns in human history. In both cases, the future is not linear but subject to the superposition of waves of different lengths, and the task is to extract these waves from noise.