Climate Harmonics: How Rhythms Explain U.S. Weather ✛
Context
This work joins a growing body of research that treats climate as a mixture of signal and noise: some neighbors separate weather noise from climate signal, others catch early warning signs of change, and still others link natural rhythms to ecosystems. Nearby studies also include predicting El Niño a year and a half ahead and quantum order emerging from noise, setting a common backdrop: variability is not random, it has structure. This article follows that line but shifts focus from trends to cyclic components, testing their predictive power on NOAA's century-long archive across all U.S. states.
Methods
The author used NOAA U.S. Climate Divisional Dataset (nClimDiv) from 1895 to 2024: mean, maximum, and minimum temperature, precipitation, and five drought indices. All series were converted to standardized anomalies relative to the 1981–2010 baseline to remove seasonal cycle and geographic differences. Then, discrete Fourier transform was applied to identify dominant frequencies, continuous wavelet transform to track their evolution over time, and the PELT method to detect abrupt regime changes. Two regression models were compared: a purely linear trend and a hybrid model that adds harmonic terms with frequencies found by Fourier. Quality was assessed by root mean square error (RMSE).
Results
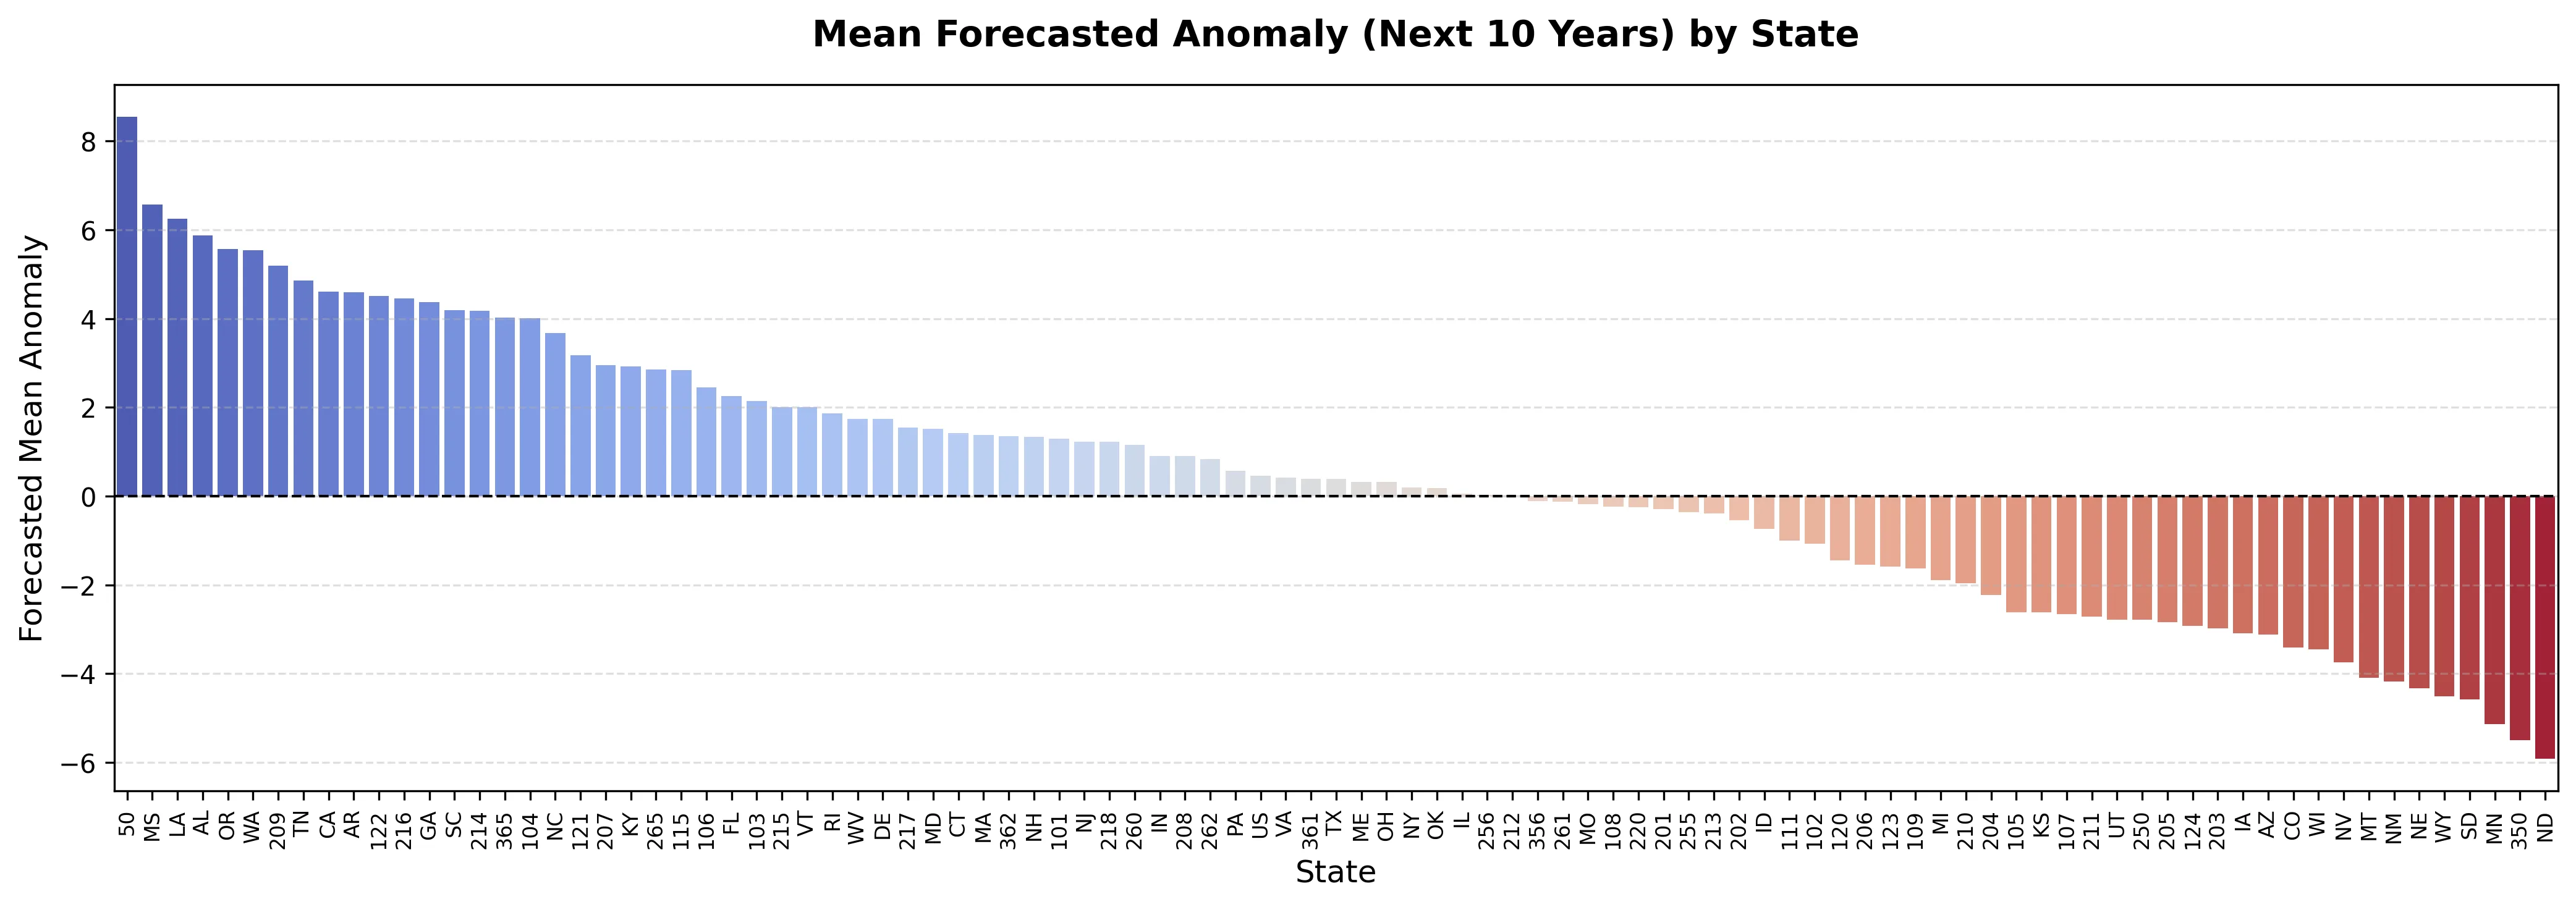
Harmonic models noticeably reduced forecast error compared to the linear trend for most states and variables. The largest gains came from temperature series due to stable seasonal periodicity; precipitation and drought indices improved less because of spatial heterogeneity. The Fourier spectrum for precipitation showed a peak near 3 cycles per year (period about 4 months), while wavelet analysis revealed a persistent annual band and enhanced power in the 2–7 year range from 1950 to 2000, corresponding to El Niño activity. The PELT method detected regime shift points in the 1930s (Dust Bowl) and 1976–1977 (Pacific shift). The forecast for 2026–2035 is centered near zero with a slight positive offset, indicating a possible increase in precipitation variability; regionally, wetter conditions are expected along the Gulf Coast and Pacific Northwest, with slight drying in the northern Great Plains.
Implications
This work differs from neighbors by systematically comparing the predictive power of harmonic components against trend models across the full set of climate variables and all U.S. states. Neighboring studies either focus on a single phenomenon (El Niño), on distinguishing noise from signal, or on ecosystem responses, but they do not provide such a complete picture of the contribution of cycles to forecasting. Here it is shown for the first time that accounting for frequency structure yields measurable accuracy improvements for most regions, strengthening the case for operational use of frequency-aware models.
Future development
The topic could evolve toward nonlinear spectral methods, such as empirical mode decomposition, singular spectrum analysis, or neural network harmonic models, to better capture changing periodicities and phase shifts. Extending to paleoclimate reconstructions and global reanalyses would test whether quasi-periodic structure persists on centennial scales and under changing boundary conditions.
Impact
The results are directly applicable to seasonal forecasting, drought monitoring, and water resource planning, where not only average trends but also oscillation phases matter. The work is also useful for agriculture and flood risk management.
Next steps
The next step is to integrate nonlinear spectral methods and test the robustness of harmonics on independent data, such as global reanalyses. It is also worth investigating the physical mechanisms behind the detected periodicities and their connection to feedbacks in the ocean–atmosphere system.
Key open problems
For climatology, the question remains open of how to separate natural internal variability from anthropogenic signal, especially at regional level. This work shows that cyclic components explain a significant portion of variance, which could help refine trend estimates and their uncertainties, as well as improve attribution of extreme events.
The knowledge machine's view
This section is addressed to the author of the paper and their colleagues. Neighbouring works were found by meaning-based search across our archive, not by word overlap. We do not review: we show the field around the work.
What the work does
Thomas Xiao's study uses 130 years of NOAA data on temperature, precipitation, and drought across the United States, applying Fourier transforms and wavelets to identify dominant periodicities such as the annual cycle and 2–7-year oscillations linked to El Niño. The author shows that harmonic models yield smaller forecast errors than a linear trend and detects abrupt regime shifts using the PELT method, including the Dust Bowl of the 1930s and the Pacific shift of 1976–1977.
Where its strength is
The strength of the work lies in its systematic comparison of the predictive power of harmonic components versus trend models across the full set of climate variables and all U.S. states, providing a comprehensive picture of the contribution of cycles to forecasting and strengthening the case for frequency-aware models.
Where it could go next
- It might be interesting to see how the methods from the paper on predicting El Niño a year and a half ahead could be adapted to improve forecasts of the 2–7-year oscillations identified in your analysis.based on: El Niño Can Be Predicted a Year and a Half in Advance arXiv:2601.12251
- A related study separates the climate signal from weather noise; applying such an approach to your data could help clarify which frequencies truly carry predictive value and which are noise.based on: Weather vs. Climate: How to Tell Noise from Signal arXiv:2608.14455v1
- It would be interesting to compare your results with the work on a forecast that remembers the cycle: it likely uses a similar idea of incorporating cycles into the model, and comparing methods could yield new insights for improving accuracy.based on: A Forecast That Remembers the Cycle arXiv:2602.18949
Worth trying
- The PELT method could be tested on shorter time windows to check how stable the detected change points are.
- It would be worthwhile to incorporate not only dominant frequencies but also their slow temporal variations, as revealed by wavelet analysis, into the harmonic model for adaptive forecasting.
- For precipitation and drought indices, region-specific harmonics could be considered, as their spatial heterogeneity may require local frequency components.
Why this may matter
Accounting for the frequency structure of climate variability could improve seasonal forecasts and drought monitoring, which is particularly important for climate change adaptation in U.S. agriculture and water management.
Nearby works in our archive
- El Niño Can Be Predicted a Year and a Half in Advancesimilarity 0.54
- Weather vs. Climate: How to Tell Noise from Signalsimilarity 0.54
- A Forecast That Remembers the Cyclesimilarity 0.50
- The Fourth Spring of Climatesimilarity 0.50
- Rain Is Learning to Fall Less Often but Hardersimilarity 0.50
- How Ancient Weather Chronicles Came to Lifesimilarity 0.50
The archive is sparse around this work: the closest review is only 0.54, against a usual 0.64. It looks like few have drilled nearby.
The precipitation spectrum peak at 3 cycles per year means that the strongest precipitation fluctuations in the U.S. occur with a period of about 4 months, not once a year as one might expect. This is because the seasonal cycle was already removed when calculating anomalies, leaving faster modes, such as those related to intraseasonal processes.
The idea of predicting climate through hidden rhythms echoes Isaac Asimov's 'Foundation', where Hari Seldon's psychohistory uncovers cyclical patterns in human history. In both cases, the future is not linear but subject to the superposition of waves of different lengths, and the task is to extract these waves from noise.
Key numbers
- data period: 1895–2024 (130 years)
- dominant precipitation period: about 4 months (3 cycles per year)
- El Niño range: 2–7 years
- RMSE improvement for temperature: largest among variables
- forecast horizon: 2026–2035 (10 years)