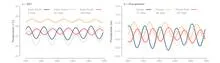
A climate network is a way of representing the Earth's climate system as a web of interacting locations. Instead of focusing on the weather at any single place, it looks at how temperature, pressure, or rainfall at different points rise and fall together over time. If two distant regions show synchronized fluctuations—say, their temperatures swing in near-unison—they are considered 'connected' in the network, even if they are thousands of kilometers apart. This approach borrows tools from graph theory, a branch of mathematics used to study relationships in systems like social networks or the internet.
History
The application of network theory to climate data gained traction in the mid-2000s, with influential papers by scientists like Reik Donner and Jürgen Kurths, who demonstrated that climate networks could reveal patterns of teleconnection and even detect early warning signals for abrupt changes.
How it works
To build a climate network, researchers first choose a set of observation points, such as weather stations or grid cells on a map. For each pair of points, they calculate a statistical measure of correlation between their time series of a variable like sea surface temperature. If the correlation exceeds a chosen threshold, an edge is drawn between those two nodes. The resulting graph reveals clusters of tightly linked regions, as well as 'hub' locations that connect many others. Analyzing the network's structure—for example, how quickly information spreads along its links—can expose hidden pathways of climate influence that simple maps miss.
In practice
Climate networks are used to study phenomena like El Niño's global impacts, to identify regions where climate variability is most strongly coupled, and to improve predictions of extreme events by monitoring the network's changing structure.
Fun fact
In some climate networks, the strongest connections are not between nearby locations but between far-flung regions linked by atmospheric waves, such as the tropical Pacific and the Antarctic.
In an oven, as temperature rises, molecules move faster and disorder increases. With language models like ChatGPT, it's the opposite. When developers increase the 'temperature' parameter, the model gets access to a wider choice of words, but its long texts suddenly start looping.
A team of researchers tested 11 different AIs by generating 12,000 text continuations.
A web where lions eat zebras and hyenas finish the leftovers is not just a list of dinners. It's a survival map for an entire region. When the climate shifts, animals move, and the map tears. To understand where it will tear and where it will hold, you need to find its unchanging 'skeleton'—the connections that repeat across different places.
In the first moments after the Big Bang, cosmic symmetry breaking divided the hot plasma into regions with different vacuums — the lowest energy states of a field.
A family tree becomes a tangle if you account for adopted children and remarriages. Evolution often resembles such a tangle: although the Standard Model, the traditional view of divergent evolution where species branch like a tree, paints a neat tree of species, in reality genes travel not only by inheritance but also directly between unrelated organisms — a process…
At a weather station in Brazos County, Texas, rain is recorded on magnetic tape: every day, four years straight. Nine hundred millimeters in a good season, a hundred in a bad one. Then the tape falls silent. Drought creeps in without a sound — the slow fading of the earth's pulse. The standard SPI-3 index only catches on a month or two later, once the moisture is already gone.
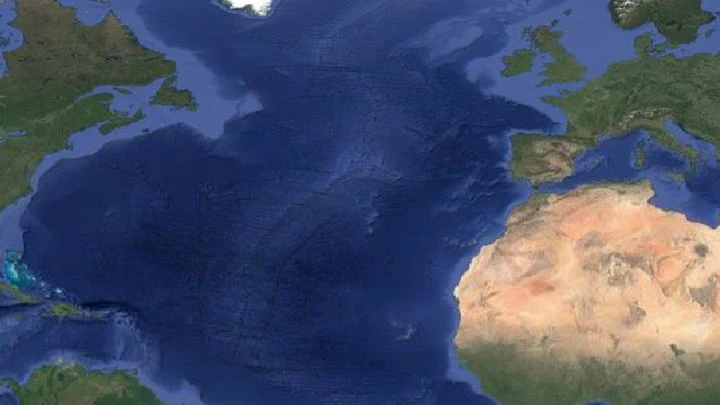
In the Atlantic, a giant invisible conveyor operates: warm surface waters flow north, cool, sink, and return south. This circulation, AMOC, carries heat, making Europe noticeably milder than Canada at the same latitudes. But the conveyor isn't eternal: if diluted by fresh water from melting Greenland ice, the engine stalls.
Drylands are like skin cracking from dehydration. When rainfall decreases, plants don't vanish overnight: they rearrange, leaving bare patches of soil between them. These patterns are visible even from space.
Scientists compared satellite images of eight arid regions, from the Sahel in Africa to Australian deserts.
Over the warm waters of the Indian Ocean, every six to eight weeks, a vast wave of moist air gathers. It moves eastward at a pedestrian pace—about five meters per second—and takes forty to ninety days to circle half the planet.
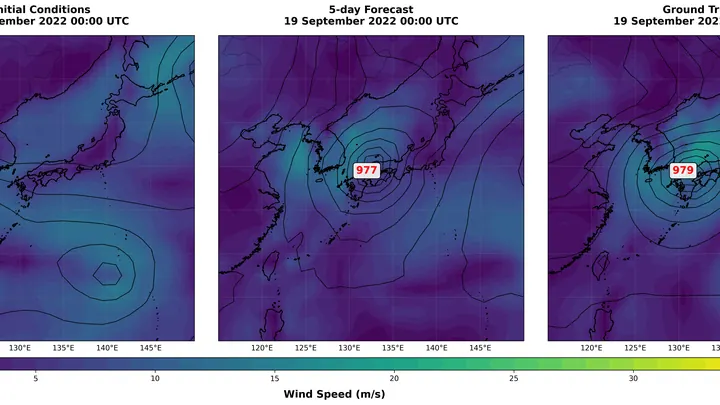
Weather forecasting is like trying to predict where a rock will roll down a slope, knowing the shape of every bump and the force of the wind. Make a mistake at the start, and a week later that error grows into a full-blown storm. In the past, accurate forecasts required massive computers and days of computation.
Two barometers hang on the wall. One reads clear, the other says partly cloudy. Which weather do you trust? That is roughly the question facing a group of climate scientists when two independent methods predicted different futures for the Pacific Ocean in 2026.
A student learned physics from a textbook and is taking an exam. The first two problems are solved brilliantly, but on the third, they err on something not covered in the book. That is roughly what the hybrid atmospheric model NeuralGCM faced when run through three levels of testing: cyclones, El Niño, and anomalous warming.
Old Chinese chronicles are full of weather entries: "no rain in the third month," "the river overflowed its banks." But these are words, not numbers. Until now, turning them into precise precipitation data was nearly impossible.
The new approach works like a translator from the language of chronicles to the language of climatology.
In 1992, Hurricane Andrew tore through Florida, leaving insurers with $$15.5 billion in losses. Many companies went bankrupt, and the market devised a way to shift disaster risk onto investors: catastrophe bonds. These securities pay generous coupons as long as a specified disaster does not occur, such as a hurricane of a certain strength or an earthquake in a particular region.
A warm ocean off the coast of Peru can make winter in Moscow unusually mild. Climate scientists call these invisible threads that link weather in distant corners of the planet teleconnections. For a long time, they were thought of as something like permanent wiring: the signal sources may pulse, but the wires themselves lie still.
The climate of the United States is not a straight line creeping upward. It is an orchestra without a conductor, where every violin and every drum plays its own part, and together they create an intricate pattern of warm and cold, wet and dry years.
Every few hours, narrow beams of radio waves leave the Mojave Desert, near Madrid, and near Canberra, heading into the sky. This is NASA's Deep Space Network: three antenna complexes that keep in touch with spacecraft across the solar system.
A translator that learned the grammar of the wind, not just the vocabulary. The wind blows over the Pacific, and the water responds with waves, currents, and upwellings of cold depths. The KIST-Ocean neural network was taught not just to memorize how the ocean looked yesterday, but to understand why it will become what it is tomorrow.
In 2015, downpours in Chennai turned streets into rivers overnight. The city was caught unprepared: seasonal models offered only a vague warning. Yet the monsoon is not a whim of the sky; it is the pulse of a vast machine linking oceans and continents.
The Pacific Ocean is a giant network of nerve endings that warns of an impending attack a year in advance. In 2023–2024, El Niño, the warm phase of the Pacific climate oscillation, pushed global temperatures to record highs. Now, two independent methods, like two doctors examining the same symptoms, agree: no new attack in 2025.
In winter, air over the Northern Hemisphere does not move haphazardly; it spends days at a time in the same pattern before rearranging itself. These patterns are like rooms in a maze: the system enters, lingers, then finds a door to another room. Each room has its own weather: somewhere over Europe it is warm and humid, while over Siberia it is frosty and clear.
Two dancers stand facing each other but cannot see each other's faces. One is the atmosphere, fast and noisy, forgetting its moves after just a couple of weeks. The other is the ocean, slow and heavy, remembering every touch for months. For the dance to work, they need to learn to lead each other while only looking at their partner's hands.
A translator at negotiations picks up not only the words but also the tone in which they are spoken. If they focus only on vocabulary, they might miss sarcasm or fatigue in the voice. If only on intonation, they could mistranslate the details of the contract.
A translator at an important negotiation starts by simply repeating words, but gradually begins to anticipate what the counterpart will say. The new weather model works similarly: physics provides the framework, and machine learning learns from errors and fills in the gaps.
Every year, the same drama unfolds over West Africa: from June to September, the sky fills with moisture and releases rains that determine the harvests of millet, sorghum, and maize. This rainy season is driven by the West African monsoon, a giant atmospheric pump that pulls moist air from the ocean deep into the continent.
Seventy-five years of weather observations in India, when plotted on a graph, resemble the cardiogram of a vast organism. Instead of a single steady pulse, there are fifteen different lines, each with its own rhythm. Somewhere the heartbeat is as steady as a sleeping person's, while elsewhere it falters, as if after a quick run.
A fisherman pulls on his net and listens to it ring. Each strand quivers in its own way, but before a strong tug, all the strands begin to vibrate in unison. So it is with complex systems: before a sharp state jump, the individual parts suddenly start to oscillate in concert, and that synchrony betrays the coming jump.
Over the warm waters of the Atlantic, air begins to swirl like water spiraling down a drain. That is a future hurricane, and its fate depends on what happens thousands of kilometers away in the Pacific Ocean. When the El Niño current warms up there, storms in the Atlantic become fewer. The models that forecast hurricane season know about this link.
In 2019, 16,000 villages in the Indian state of Maharashtra ran dry, and authorities began distributing water by ration coupons. In response to such crises, the government plans to transfer water from water-rich river basins to arid ones through a network of canals stretching 15,000 kilometers.
A meteorologist looks at a map where clouds gather in flocks, like birds before a storm. Each spot on the radar could be a future downpour or just noise. Earth system forecasting is like trying to assemble a puzzle with thousands of pieces that keep changing shape.
In 1960, a meteorologist at a station in Peru records water temperature, while a farmer in India watches the sky waiting for the monsoon. There is no direct link between these two events, but months later one will echo in the other.
The ocean resembles a giant web, where each thread connects distant points of water. When one spot warms, winds and currents change thousands of kilometers away. The neural network in this study wove such a web for the first time on its own to predict El Niño.
In 2021, two tools designed to forecast weather a year ahead showed different results. One, built on connections between temperatures at different points in the Pacific Ocean, was silent: no El Niño in 2022.
Two people are talking at once, and by the loudness of their voices you can't tell who is answering whom. That's how climatologists have for decades searched for a link between warm water off the coast of Peru and droughts in Australia: they compared how synchronously ocean temperature and rainfall change in different parts of the planet.
Imagine a house of cards where each card supports the others. One wobbles, and the neighbors start to lean. Earth's climate system works similarly: ice sheets, ocean currents, tropical forests, all are connected. If one element crosses a threshold, it can drag the rest down with it.
Every June, the sky over India fills with moisture, and how much falls determines rice harvests, water reserves, and food prices for a billion people. But predicting the monsoon's strength in advance was like guessing someone's mood from a single photo: too many hidden springs.
On a playground, two swings stand side by side. One child pumps on their own, while the other barely moves until the first gives a push with their foot. Something similar happens in the tropical Pacific and Indian Oceans, except instead of children, there are warm and cold masses of water.
Every morning in six American cities, from Chicago to Minneapolis, faucets open at the same time coffee makers switch on. Water and electricity flow through pipes and wires like two connected vessels in the city's body. In the past, utilities monitored these flows separately, as if the organism had no common circulatory system.
Picture a globe divided into cells: near the poles they shrink into narrow wedges, while at the equator they stretch into wide bands. If you connect random points on such a globe with lines, the compass arrows will lie: connections will point to where there are more cells, not where the flows actually go.
Picture a web stretched across every corner of the Earth: each strand is a coincidence of temperature fluctuations at two points. In ordinary years, the web is neatly divided into regional clusters, but when El Niño arrives, the strands break and reweave, linking distant continents.
Imagine a border river that separates two countries. On one bank live one group of people, on the other, another. The boundary between them is not always obvious: in some places the river is wide and calm, in others narrow and turbulent. But it is exactly where the current changes abruptly that the border becomes most noticeable.