Wavelet analysis is a mathematical technique for breaking a signal into components that are localized in both time and frequency. Unlike the Fourier transform, which gives a global frequency spectrum and loses all time information, wavelets use small, finite 'waves' (the wavelets themselves) that are scaled and shifted to match features that appear and disappear. This makes it ideal for studying transient events, sharp edges, or signals with changing frequency content, such as seismic waves, heartbeats, or audio bursts.
History
The modern theory was developed in the 1980s by Jean Morlet and Alex Grossmann, building on earlier ideas in mathematics and signal processing. Ingrid Daubechies later constructed compactly supported orthogonal wavelets, making the method computationally practical.
How it works
A wavelet is a small oscillating function that is nonzero only over a short interval. The analysis works by comparing the signal to many scaled (stretched or compressed) and shifted (translated) versions of this wavelet. At each scale and position, a coefficient measures how well the wavelet matches the local shape of the signal. Large coefficients indicate strong similarity, revealing where and at what scale a feature occurs. The result is a two-dimensional map (scale vs. time) that shows how the signal's frequency content evolves.
In practice
Used in JPEG 2000 image compression, medical imaging (e.g., MRI denoising), earthquake detection, and analysis of gravitational wavesignals.
Fun fact
The word 'wavelet' comes from the French 'ondelette', meaning 'small wave', and the first practical wavelets were developed by a geophysicist looking for oil.
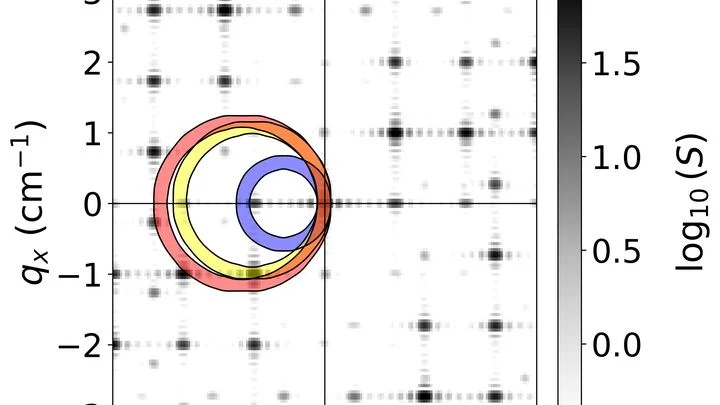
Waves on the water's surface usually break against any obstacle — a rock, a piling, an island. But what if you arrange obstacles so cleverly that the wave barely notices them? In a new study, scientists assembled a pattern of many points on the water, arranged according to special mathematical rules, and sent waves through them.
You could send a short radio pulse toward a black hole and wait for the reflected echo. Intuitively, the shorter the signal, the better it would probe the finest details of spacetime right at the horizon: that region from which even light cannot return.
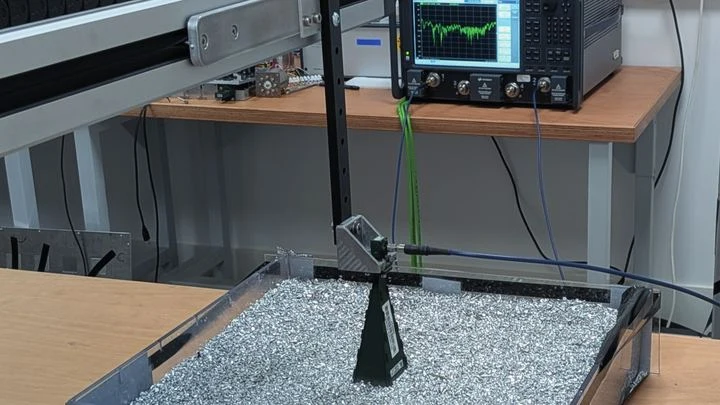
Physicists have achieved three-dimensional Anderson localization of electromagnetic waves — a phenomenon where waves become permanently entangled in a random labyrinth of metal particles and cease to propagate.
The lungs are not two bags but millions of tiny sacs where air enters and blood flows close by. To see how they work, doctors sometimes use MRI without contrast: the scanner picks up weak signals from the tissues themselves. But these signals are like a radio in a thunderstorm — breathing is irregular, pulse jumps, and the image falls apart.
When two atomic nuclei collide, the outcome depends on their energy and the angle at which the fragments fly apart. Typically, such calculations demand enormous computing power, and accuracy hits a wall due to approximations.
To spot a dim star above a brightly lit city, astronomers subtract one image from another — removing the glare of streetlights. They do the same with living neurons: their faint flashes drown in noise, but if you subtract everything unchanging, only they remain.
Thousands of kilometers of fiber-optic cables lie on the ocean floor. They carry internet traffic, but the cables themselves sense the slightest vibrations in the water and the seabed. If you listen closely to such a cable, you can hear a blue whale singing or the ground trembling thousands of kilometers away.
The heart beats, and on a paper ECG strip, each beat looks like a sharp spike with two humps: a quick rise, then a smaller wave, then a descent. A doctor looks at such a strip and sees the rhythm, but the shape of each spike, how exactly the muscle contracted, is hard to discern, especially if the recording lasts a full day.
This new method turns that strip into a colorful carpet.
Radio telescopes scattered across the globe pick up waves from distant black holes. But two telescopes placed almost side by side see only a blurry blob — fine details are beyond them. Usually, such pairs are considered useless and discarded. But that's a mistake: even a blurry blob holds clues.
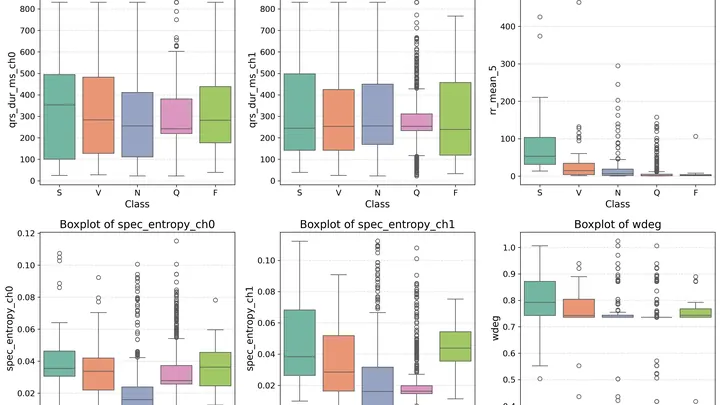
An electrocardiogram is like a musical score, where each note is a heartbeat. A doctor hears the melody and spots the off-notes — arrhythmia. But listening to the score for hours is tiring, so a smart monitor is placed by the patient's bedside.
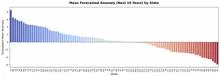
The climate of the United States is not a straight line creeping upward. It is an orchestra without a conductor, where every violin and every drum plays its own part, and together they create an intricate pattern of warm and cold, wet and dry years.
An orchestra plays a complex piece, and each group of instruments enters on its own schedule. The violins might slow down while the woodwinds keep the same tempo, and the percussion might suddenly burst into a roll. The conductor hears everything at once, but pinpointing the exact moment when the flutes, not the cellos, changed rhythm is nearly impossible.