Longer Loop, Slower Flare express
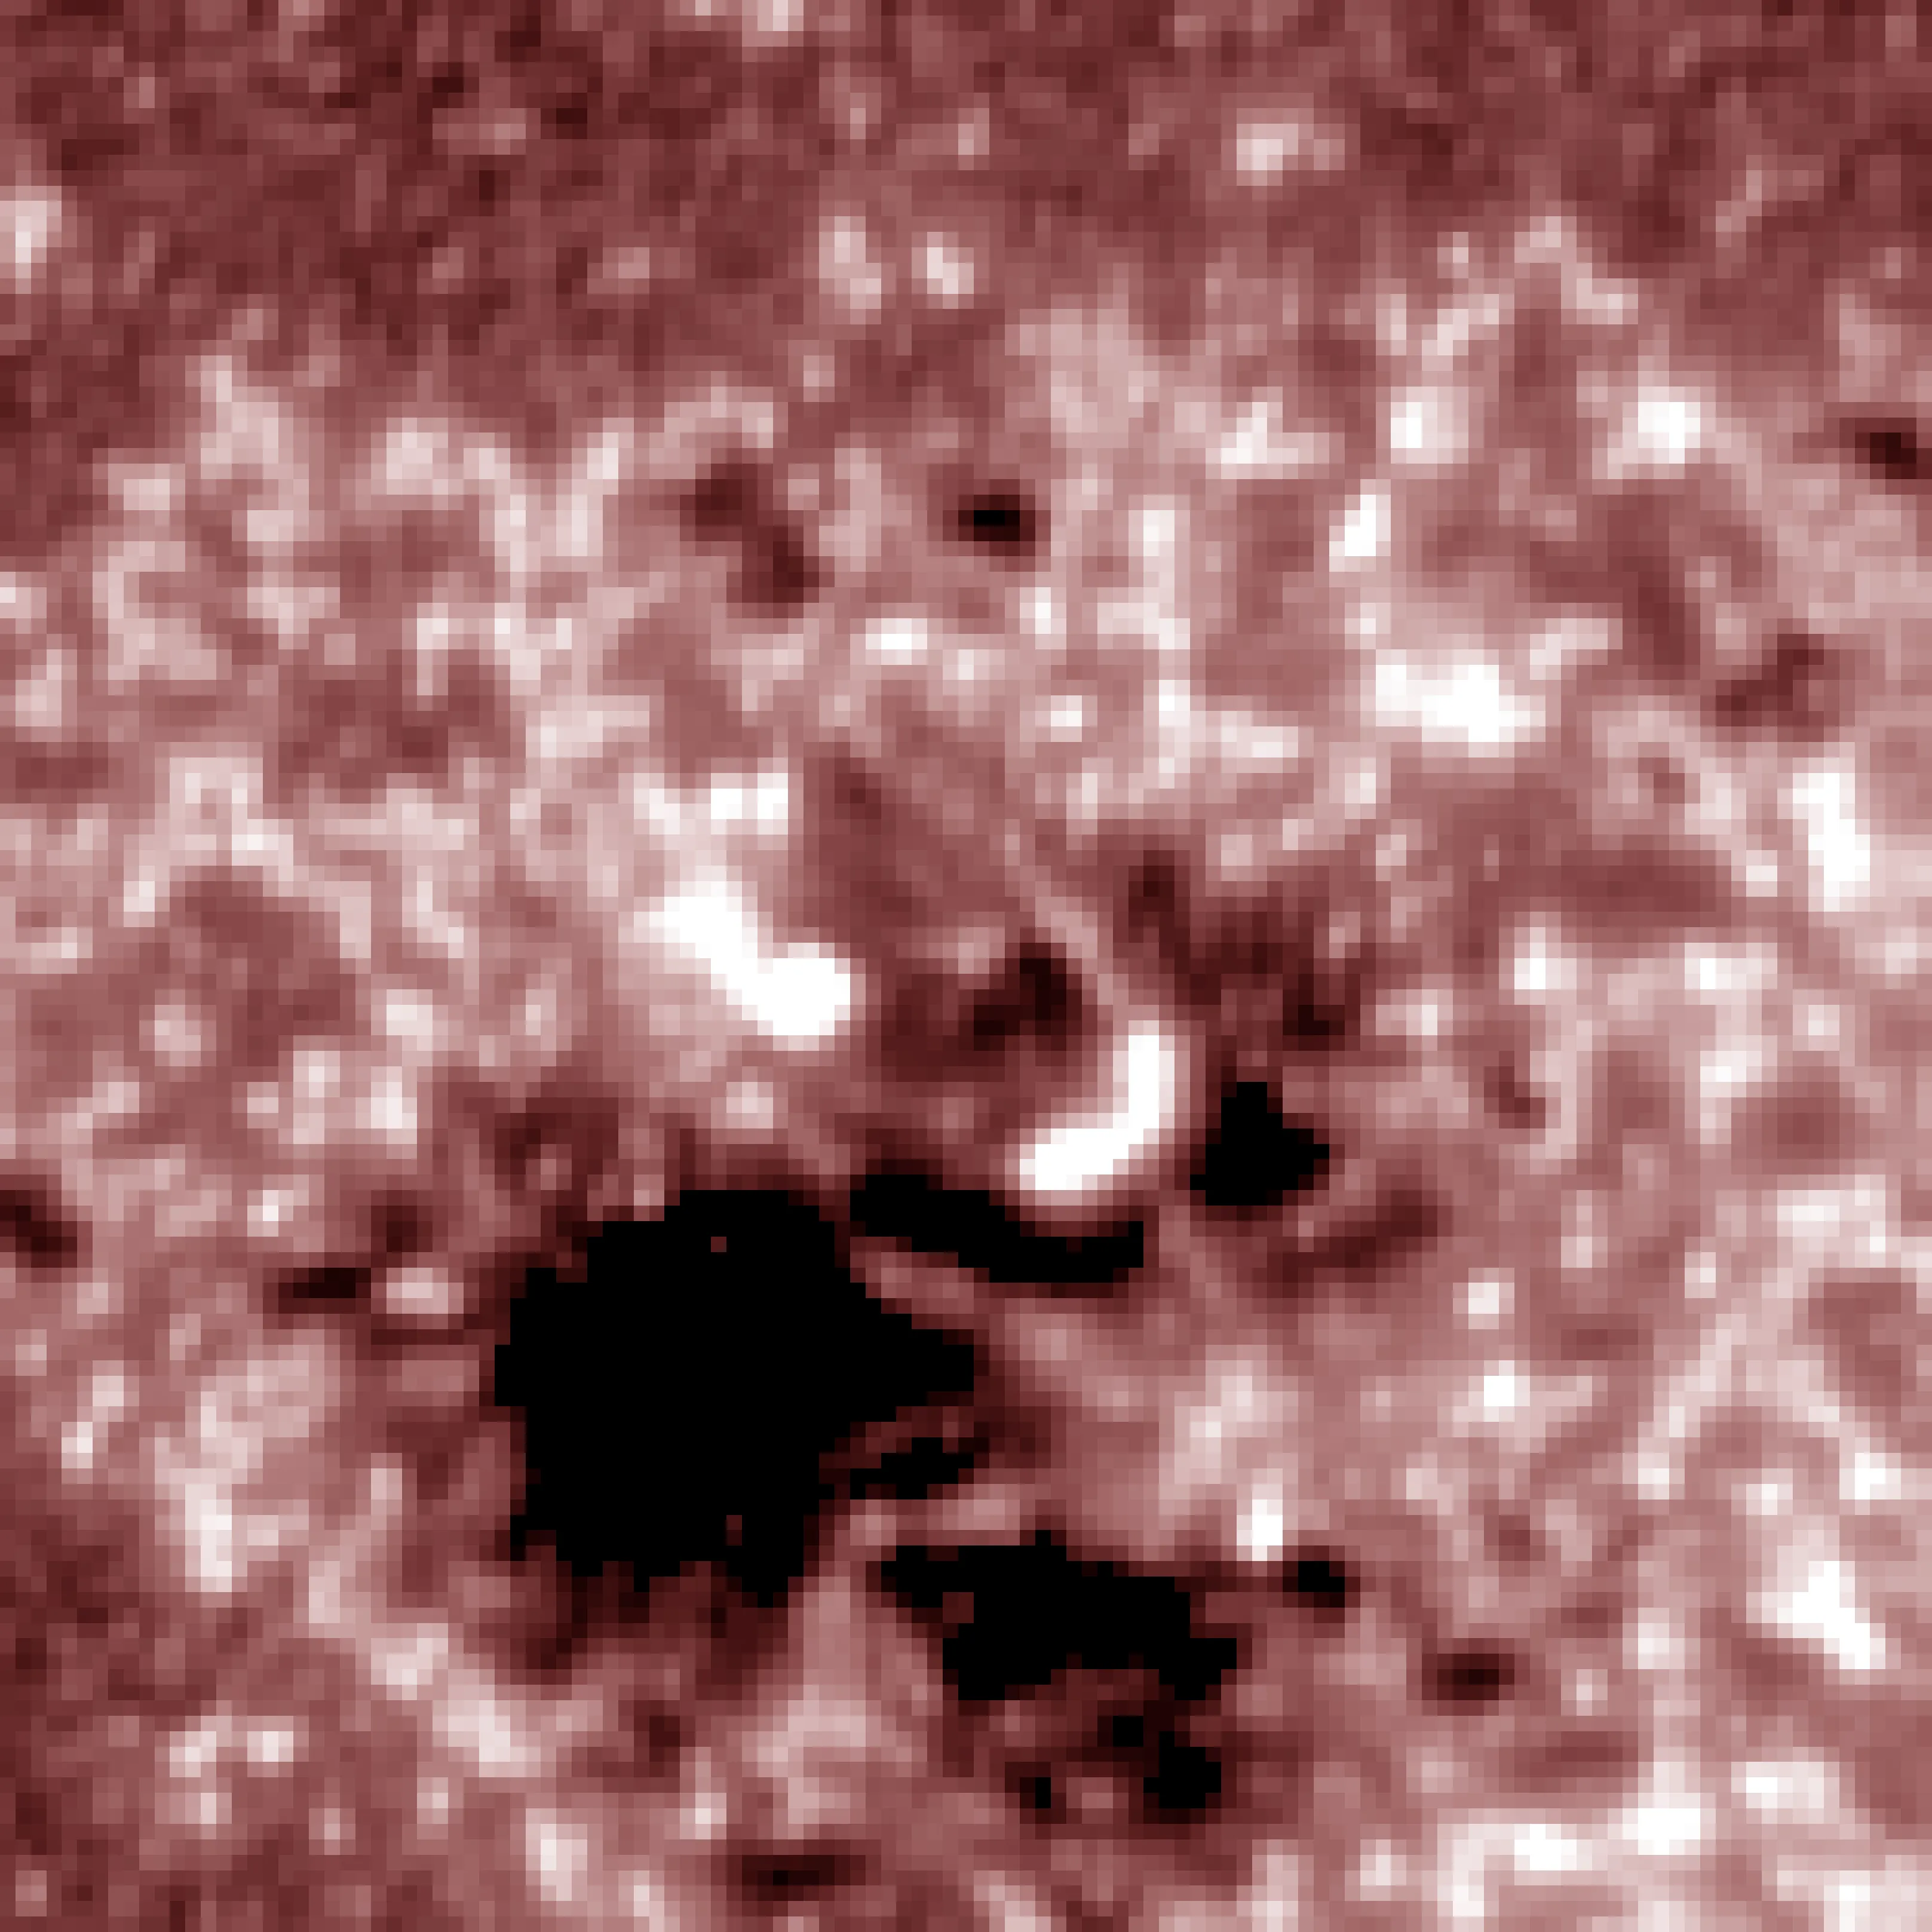
A solar flare is like a short circuit in a giant neon sign. Inside the Sun, magnetic fields twist into loops, like rubber bands, and when they reconnect, energy bursts into space. Part of it goes into hard X-rays, produced by particles accelerated to nearly the speed of light. Another part heats the plasma in the loop, which then glows in soft X-rays. The peak of the soft emission lags behind: first, particles slam into the loop's footpoints, and only then does the evaporated gas fill the loop and cool down.
Astronomers tested this mechanism on 96 flares of classes C, M, and X that occurred from 2013 to 2015. For each flare, they measured the loop length from ultraviolet images of its footpoints and compared it with the delay between the X-ray peaks. The result was striking: for the shortest loops, the delay was less than a minute; for the longest, more than ten minutes. All points fell on a single straight line, like beads on a string: correlation coefficient 0.88.
This is not just a pretty pattern. It explains why solar flares vary so much in duration. The magnetic loop sets the tempo for the entire event: a short loop flares and fades quickly, like a firecracker; a long one drags on, like a smoldering fuse. And the better scientists can predict flare behavior, the more reliable the protection of satellites and power grids from solar storms.
Original abstract
as written by the authors arXiv:2602.19836
We investigate how the magnetic loop length of solar flares relates to the timing between their thermal and nonthermal emission signatures. Our study analyzes a sample of 96 C-, M-, and X-class flares observed between 2013 and 2015 with soft X-rays, hard X-rays, and extreme UV. For each event, we determine the time delay {\Delta}t between the hard X-ray and soft X-ray peak, and estimate the flare loop length L from UV footpoints assuming a semicircular geometry. In every case, longer flare loops are consistently associated with larger timing delays. Across the full sample, we find a strong correlation, R = 0.88 between L and {\Delta}t. We also quantify how closely each flare follows the Neupert effect using a coefficient RN, defined as the Pearson correlation between the time derivative of the soft X-ray flux and the hard X-ray light curve. Applying correlation thresholds of RN > 0.5 and RN > 0.8 yields subsets of 87 and 46 events, respectively. In both cases, the linear relationship between loop length and peak delay remains clearly expressed. For the RN > 0.5 subset, the correlation is R = 0.87, while the more selective subset with RN > 0.8 displays an even stronger correlation of R = 0.91. These results show that the overall trend persists across increasingly stringent correlation thresholds. The results provide direct observational confirmation that magnetic loop geometry plays a key role in governing the temporal evolution of energy transport in solar flares.
The longest loops during strong flares can stretch for hundreds of thousands of kilometers — more than the distance from Earth to the Moon.
In the series 'The Expanse', solar flares threaten ships and colonies, and their power depends on the size of magnetic structures on the star — much like described in this work.