Three Oceanic Conductors Control Iran's Rains
In 2019, northern and southwestern Iran received 50% more rainfall than usual, and rivers overflowed their banks. A year earlier, in 2018, rainfall was 53% below normal, and fields cracked under drought. Such swings are not random; they are responses to three distant oceanic pulses that set the rhythm for Iran's rains.
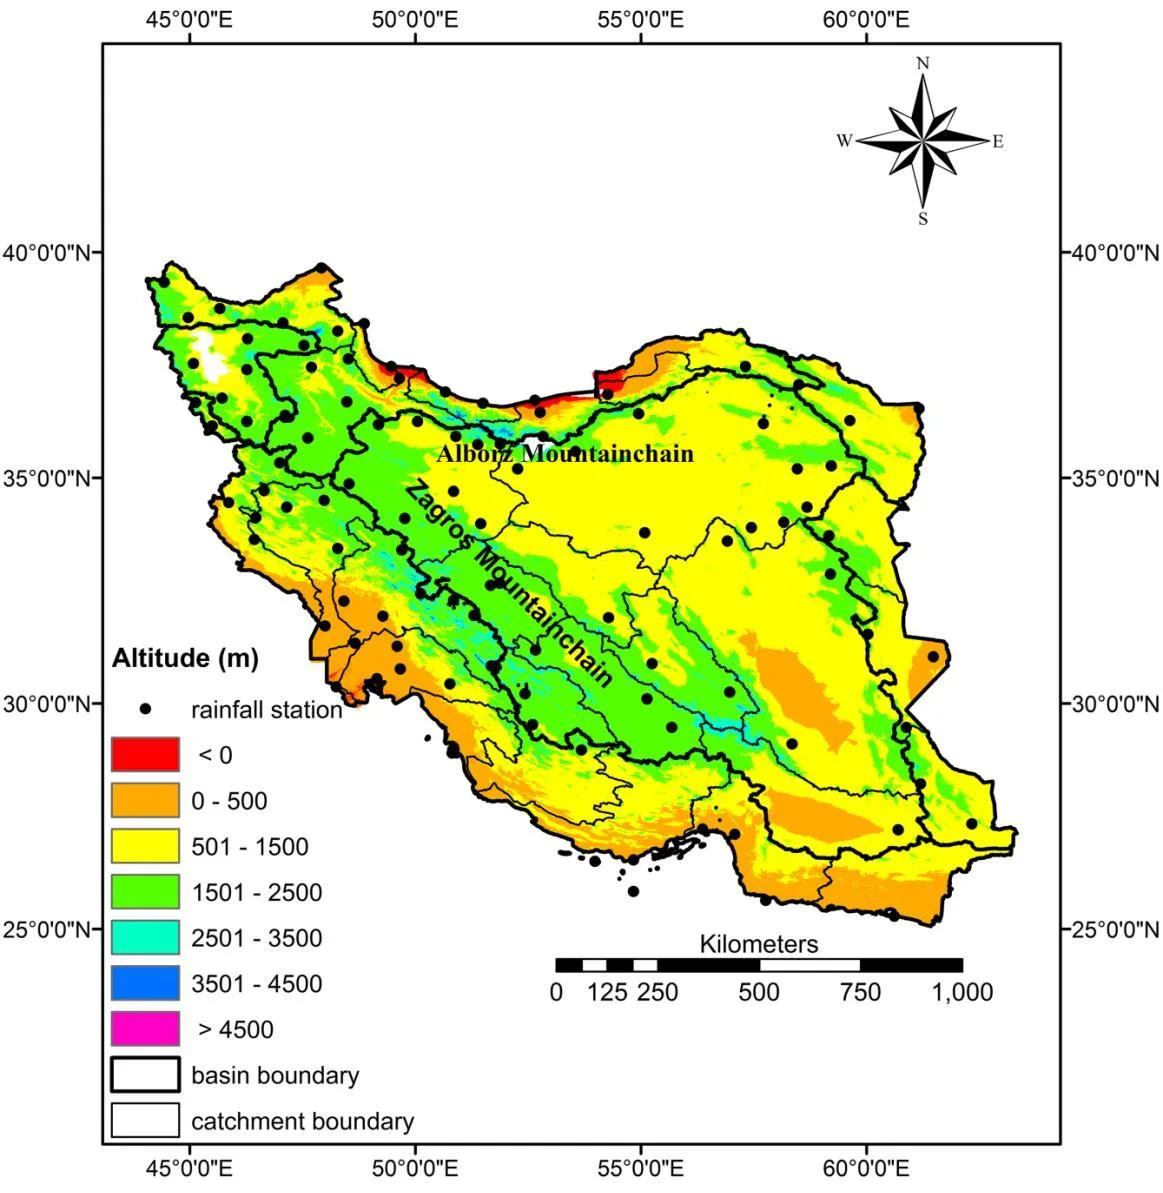
The researchers took data from 103 synoptic stations across Iran over 30 years (1987–2016) and compared seasonal precipitation totals with monthly values of these indices from the preceding 12 months. For each station, they identified the month with the strongest correlation, then divided index values into five phases, from strongly negative to strongly positive. For each phase, they calculated the percentage deviation of precipitation from the long-term average.
In the neutral phase, all three indices most often lead to reduced precipitation. Reductions can reach 100%, meaning a season with no rain at all, while increases can exceed 100% of the norm, as in 2019. This sensitivity map allows for early assessment of what to expect in the coming season, given the phase of the indices.
Previously, it was known that climate indices affect precipitation in Iran, but quantitative estimates for all seasons and all three indices together were lacking. Now, for each station and season, one can say by what percentage precipitation will change under a given phase of SOI, NAO, or PDO. These maps can be used in planning dam operations, allocating irrigation water, and assessing drought and flood risks.
In some parts of Iran, such as Yazd, average annual precipitation is just 51 mm, while on the Caspian coast at Bandar-e Anzali it reaches 1730 mm per year, a 34-fold difference. Yet even in arid regions, an El Niño phase can more than double seasonal precipitation.