Precipitationanomaly is a measure of how much rainfall or snowfall in a specific place and time deviates from what is typical for that location and season. Instead of reporting raw rainfall totals, which vary naturally from year to year, climatologists compare observations to a long-term average (usually 30 years). The difference—positive if wetter than average, negative if drier—is the anomaly. This framing isolates unusual events from the background climate, making it easier to detect droughts, floods, or shifts in weather patterns.
History
The concept emerged in the early 20th century as meteorologists began systematically comparing current weather to long-term station records, though the precise term 'anomaly' became standard with the rise of numerical climate analysis in the 1960s.
How it works
To compute an anomaly, scientists first establish a climatological baseline: the mean precipitation for each calendar month or season over a reference period (e.g., 1981–2010). For a given month or year, they subtract this baseline from the actual measured precipitation. The result is expressed in millimeters or as a percentage of normal. Anomalies are often averaged over large regions or long periods to reveal large-scale climate signals, such as El Niño or monsoon variability, that would be hidden by local weather noise.
In practice
Used in drought monitoring, seasonal forecasting, and climate change attribution studies to quantify how much human-induced warming has altered regional rainfall.
Fun fact
A single heavy storm can produce a precipitationanomaly larger than the entire annual average in arid regions, which is why anomalies are often reported as percentages rather than absolute values.
A storm in the upper atmosphere lasts a few millionths of a second. A cosmic ray, a proton or a helium nucleus, strikes air molecules, sending a swarm of particles downward. Most of them stay together, but occasionally one particle gains so much energy that it surges ahead.
A basin of wet sand. You press in one corner, and water starts moving. But how exactly? Instead of an even circle, it might spread in tongues, linger in some spots, and rush through others. Underground, the same thing happens: oil, water, or gas migrate through rocks not by the textbook, but following the chaos of fractures and heterogeneities.
At a weather station in Brazos County, Texas, rain is recorded on magnetic tape: every day, four years straight. Nine hundred millimeters in a good season, a hundred in a bad one. Then the tape falls silent. Drought creeps in without a sound — the slow fading of the earth's pulse. The standard SPI-3 index only catches on a month or two later, once the moisture is already gone.
Two pendulums suspended from a single invisible spring swing in a shared air current. One always lags the other by exactly half a period: when the first swings left, the second is already returning from the right. By watching the first, you can tell where the second will be half a period later.
Perth residents know: when the daytime heat becomes unbearable, relief arrives from the ocean — a fresh breeze affectionately called the Freo Doctor. The same wind, only on a global scale, decides the fate of cosmic visitors plunging into the atmosphere. A meteorite fall is a two-act spectacle.
A mosaic of large colored tiles. Each tile is the average precipitation over an entire month for an area the size of a small country. For a general understanding, the picture is fine, but if you need to know whether a downpour hit a specific city yesterday, it's useless.
A stone falls into a pond, and the ripples on the water tell for a long time where it sank. With a black hole, it would seem, things are different: everything that crosses the horizon (the boundary from beneath which not even light can escape) vanishes without a trace.
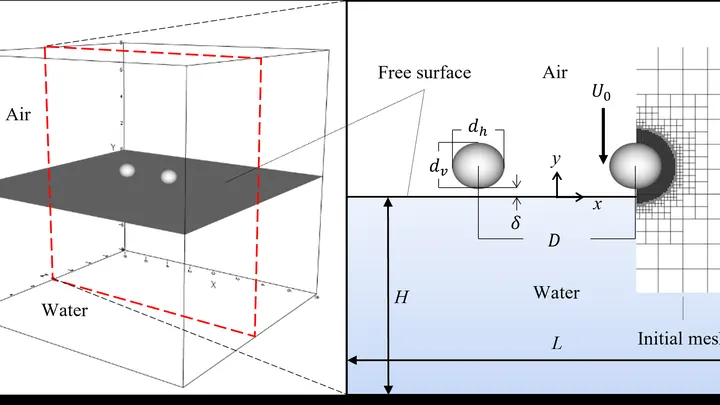
A raindrop falls into a puddle, and the impact sends up a little fountain of fine spray. Each of those droplets is a new, secondary drop. How many there are, how big they are, and how long they live depend on a host of factors: the fall speed, the drop size, the properties of the water. Scientists set out to make sense of this chaos using computer simulations.
The weather on the next street can differ from yours: cooler by the river, hotter over asphalt, windier between buildings. A regular forecast misses this: its grid cell is the size of a city, not a backyard.
Old Chinese chronicles are full of weather entries: "no rain in the third month," "the river overflowed its banks." But these are words, not numbers. Until now, turning them into precise precipitation data was nearly impossible.
The new approach works like a translator from the language of chronicles to the language of climatology.
The pulsar in the Crab Nebula blinks like a lighthouse: every 33 milliseconds it sends out a radio pulse, and it does so with the precision of atomic clocks. But sometimes its rotation stumbles: the star suddenly speeds up slightly, as if something inside it is shifting.
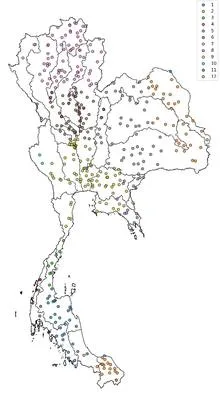
Tuning an old radio receiver requires patience: you slowly turn the dial, catch a crackle, turn it again, until a voice emerges through the static. In much the same way, a reinforcement learning agent searched the ocean for two patches whose temperature difference best predicts rains in Thailand.
Rain doesn't fall just any old way. If you take records from nearly fifty thousand rain gauges scattered across the globe and compare how much water falls on a rainy day in different parts of the planet, you'll spot a surprising pattern.
Picture a chef flicking water onto a sizzling skillet. The droplets instantly hiss and evaporate, giving immediate feedback on the temperature — far quicker than any thermometer. This intuitive idea underpins a new approach in quantum thermometry.
Paraglider, hang glider, and glider — three different wings, but in the sky they behave the same. Pilots catch invisible warm air currents, rise on them, then glide to the next. Such flight is like a game of hopscotch: a jump upward, then a glide forward, and again a search for a place to jump.
Scientists analyzed thousands of real routes and found a common law.
Every day, about 40,000 thunderstorms flash across the planet. In that moment, the atmosphere resembles an orchestra without sheet music: warm air rises like a bow stroke, winds aloft carry the melody, and lightning punctuates the finale. But who conducts this orchestra?
A camera on a tripod shoots the same landscape for decades. If you don't touch the lens, the images get hazy: the landscape changes, but the focus stays put. That's roughly how climate norms work. According to World Meteorological Organization rules, they are calculated as the average over the last 30 years.
For 36 days, tropical cyclone Freddy raged over the Indian Ocean, the longest-lived cyclone on record. Meteorologists tracked it from satellites, aircraft, and ground stations. But one detail eluded all instruments: the precise air density deep within the vortex. And that density determines where the cyclone will turn tomorrow.
In May 2024, thermometers in Jalisco seemed to go haywire: on May 10, one station recorded 38.4°C, nearly matching the historical maximum from 1994. The heat was so intense that even agave plants, accustomed to scorching conditions, slowed their growth. And the rains, which usually arrive in June, were delayed, leaving farmers nervously glancing at the sky.
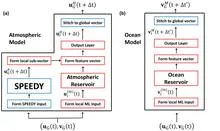
A translator at an important negotiation starts by simply repeating words, but gradually begins to anticipate what the counterpart will say. The new weather model works similarly: physics provides the framework, and machine learning learns from errors and fills in the gaps.
In February 2022, the eastern coast of Australia was hit by rains that lasted several days in a row. Water inundated towns in Queensland and New South Wales, insurers paid out 3.35 billion dollars, and the flood became the costliest in the country's history.
In the mountains, an echo repeats any shout, and you can't immediately tell who shouted: a person or the wind. That's roughly how climate scientists work when they try to understand why an unusual heat wave or drought happened. They look for a human fingerprint in a weather disaster, but nature has its own voices that can sound similar.
An interpreter at a negotiation hears not only the volume of the voice but also the shift in topic. Climatologists have long listened only to volume: the average temperature. If it rises, the planet is warming. But behind the average hide events that matter more than the trend: heat waves, cold snaps, sudden changes.
In 2019, 16,000 villages in the Indian state of Maharashtra ran dry, and authorities began distributing water by ration coupons. In response to such crises, the government plans to transfer water from water-rich river basins to arid ones through a network of canals stretching 15,000 kilometers.
A conductor in a concert hall waves a single baton, yet violins and timpani respond differently. Likewise, the warm patch in the Pacific Ocean known as El Niño makes different corners of Russia experience completely different winters under the same phase. Somewhere snow melts in January, while elsewhere frosts intensify to the limit.
Imagine an interpreter who gets distracted by every rustle in the hall. The more rustles, the more errors in the translation, even though the meaning of the speech hasn't changed. The same happens with data: if measurements are unevenly spaced, standard analytical tools start "hearing" changes that never occurred in the underlying process.
In the Pacific Ocean, every few years the water off the coast of Peru warms up, and fishermen call it El Niño. Sometimes the warming is mild, sometimes so strong that it changes weather across the entire planet. Forecasting a strong El Niño six months to a year ahead is a task at the edge of possibility: weather is forgotten within two weeks, while climate remembers for decades.
In 1884, British meteorologist Henry Blanford built the first model for forecasting the Indian monsoon. Nearly a century and a half later, seasonal forecast skill has barely improved.
Every summer, the same scene unfolds over India: clouds driven from the ocean by the wind release their rain, and how that rain falls on the fields determines the harvest for more than a billion people. Meteorologists have long tried to reduce this mosaic to a single number, the all-India rainfall index, which averages millimeters across the country.
Every summer, a giant atmospheric engine unfolds over India: moist ocean winds bring the rains that sustain crops and the lives of two billion people. But this engine sputters, and forecasting it a season ahead remains elusive. Models give only rough answers, and a monsoon forecast error can cost millions of tons of food.
In 1984, the Ethiopian sky stayed silent for months. Fields cracked, livestock died, and roads were clogged with people fleeing hunger. Droughts in this country have killed hundreds of thousands, but warning of them in advance was impossible: too many threads pull the weather in different directions.
The Pacific Ocean works like an invisible conductor.
In February 2017, Lima, a city of over ten million people, was hit by El Niño: the warm current off Peru's coast brought torrential rains, floods, and landslides. More than a hundred people died, thousands of homes were destroyed, and roads turned into rivers. The city's economy, like a living organism, fell out of rhythm: shoppers visited stores less often, and their spending patterns shifted almost overnight.
Every June, the sky over India fills with moisture, and how much falls determines rice harvests, water reserves, and food prices for a billion people. But predicting the monsoon's strength in advance was like guessing someone's mood from a single photo: too many hidden springs.
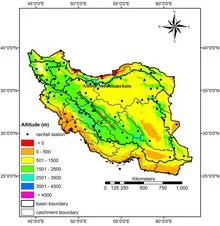
In 2019, northern and southwestern Iran received 50% more rainfall than usual, and rivers overflowed their banks. A year earlier, in 2018, rainfall was 53% below normal, and fields cracked under drought. Such swings are not random; they are responses to three distant oceanic pulses that set the rhythm for Iran's rains.
The Indian summer monsoon feeds a fifth of humanity, but its seasonal forecast has been considered nearly hopeless for decades: the potential predictability limit was estimated at only 45% of explained variability.
In 1998, the Pacific Ocean off the coast of Peru suddenly cooled, and tropical rains seemed to take a deep breath. Wet zones, where more than three meters of water falls in a year, crept westward, while dry patches, where less than two hundred millimeters accumulate, expanded off the coasts of Australia and the Americas.
On April 16, 2012, Washington experienced heat no one expected. The thermometer climbed 18 degrees above normal. Sixty days earlier, Bucharest and Kyiv had weather unusual for them. The link between these events was found by an algorithm that scans pairs of cities worldwide, looking for recurring coincidences.
The coast works like a conductor: it doesn't create the music, but it sets the rhythm and direction. Every morning, the sun heats the land faster than the sea, and warm air rises over the sand, pulling in a moist breeze from the ocean. By evening, the land cools and the wind reverses. This daily pendulum lines up clouds along the water's edge, like musicians following the baton.
In a room with a hundred people, you can measure each person's height and compute the average. But if someone infinitely tall walks in, the average height ceases to exist: no matter how many more people you add, the sum grows without bound.
On an old film strip of rainfall, only the brightest frames are visible, and between them lies noise. A meteorologist assessing flood risk long looked only at such frames, that is, at annual rainfall maxima. Everything else, thousands of daily observations, remained off-screen. The new method develops the entire film, and details that were previously invisible come into view.