Iran's Seasonal Rains Follow Three Oceanic Pulses
Context
Iran sits in an arid and semi-arid region where precipitation is less than one-third of the global average. Year-to-year variability is enormous: the 2018 drought cut precipitation by 53% compared with the 49-year average, while in 2019 precipitation surged by 50%, triggering devastating floods in the north and southwest. Meanwhile, the country's population grew from 50 to 80 million over 30 years, making water management critical. This work fits into the broader effort to link climate indices to precipitation, but neighboring papers in the archive focus on other regions or methods: some revive old weather records, others examine changing rain intensity, and still others predict El Niño. This study fills the gap for Iran by considering all seasons and three indices at once.
Methods
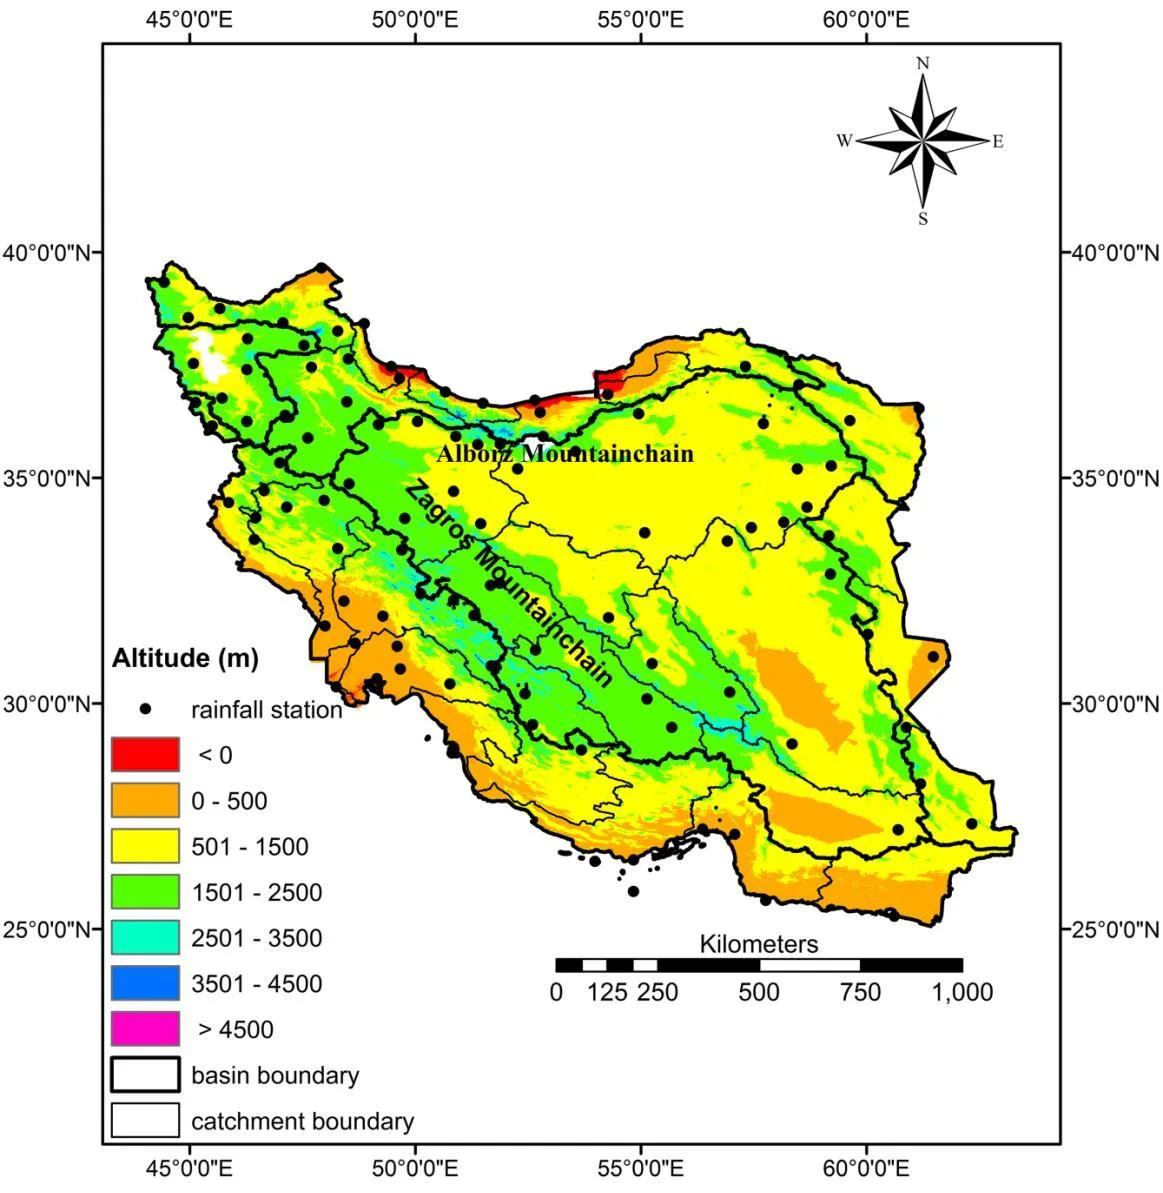
The authors used data from 103 synoptic stations in Iran with continuous records of at least 30 years (1987–2016), selected from 220 stations after screening for trends, homogeneity, and randomness. For each station, seasonal precipitation totals were compared with monthly values of SOI, NAO, and PDO from the preceding 12 months. They computed Spearman's rank correlation coefficient and, for each index, picked the month with the strongest absolute correlation at a significance level of 0.05. Index values were then split into five phases (strongly negative, negative, neutral, positive, strongly positive), and for each phase they calculated the percentage deviation of seasonal precipitation from the long-term norm.
Results
SOI, NAO, and PDO all have significant impacts on seasonal precipitation, with SOI the strongest. Significant correlations with winter precipitation appeared at 72, 53, and 51 stations for SOI, PDO, and NAO, respectively; with spring precipitation at 74, 16, and 51 stations; and with autumn precipitation at 89, 33, and 38 stations. Summer shows the weakest influence, with significant links at only 30, 25, and 47 stations. Overall, SOI correlates significantly with precipitation at more than 70% of stations in autumn, winter, and spring. Correlations mostly fall between -0.6 and 0.6. In winter, SOI acts opposite to PDO and NAO: El Niño (negative SOI) boosts precipitation across nearly the whole country, while the warm phase of PDO and the cold phase of NAO reduce it. In other seasons, no single pattern emerges; each index affects different regions differently. In the neutral phase, all indices most often lead to reduced precipitation. Decreases can reach 100% (meaning no rain at all in a season), while increases can exceed 100% of the norm.
Implications
This work stands out from neighboring studies because it covers all of Iran, all four seasons, and three climate indices simultaneously, and it is the first to quantify the percentage change in precipitation for different index phases. Neighboring papers either focus on other regions or use different approaches, such as analyzing old records or predicting El Niño a year and a half ahead. Here, the authors provide a ready-made map of Iran's precipitation sensitivity to global climate signals, which can be directly applied to water resource planning.
Future development
This line of research could move toward probabilistic forecasts: instead of the average precipitation change for each index phase, one could estimate the probability of different scenarios. It would also be valuable to study the physical mechanisms linking oceanic anomalies to atmospheric circulation over Iran, and to include additional indices such as the Indian Ocean Dipole. Longer data records would strengthen the reliability of the correlations.
Impact
The results could be used in hydrology, agriculture, and water resource management, particularly in planning dam operations and irrigation systems. They are also useful for early warning systems for droughts and floods.
Next steps
A natural next step would be to develop a probabilistic model linking climate index phases to expected precipitation at each station. It is also necessary to investigate the physical mechanisms behind the observed correlations to distinguish cause and effect from mere coincidence.
Key open problems
For Iran's hydrology and climatology, the problem of reliable seasonal precipitation forecasts remains unsolved. This work shows that large-scale climate indices explain a significant portion of the variability, but correlation does not imply causation, and practical forecasting requires understanding the underlying physical mechanisms.
In some parts of Iran, such as Yazd, average annual precipitation is just 51 mm, while on the Caspian coast at Bandar-e Anzali it reaches 1730 mm per year, a 34-fold difference. Yet even in arid regions, an El Niño phase can more than double seasonal precipitation.
Key numbers
- Number of stations: 103
- Minimum record length: 30 years
- Maximum decrease in precipitation: up to 100%
- Maximum increase in precipitation: more than 100%
- Percentage of stations with significant SOI correlation in autumn: 86%