Propagating a Storm: How the TEAMS Algorithm Grows Rare El Niños ✛
In 1997, the Pacific Ocean warmed so much that corals bleached from Indonesia to the Galápagos, and floods and droughts swept across five continents. Such events, which climate scientists call extreme El Niños, occur every few decades, and to understand how often they will arrive in the future, we need thousands of years of observations. Direct climate simulation over such timescales requires computational power comparable to forecasting weather a hundred thousand years ahead. The authors of a new study propose a workaround: instead of waiting for a rare event, they propagate its trajectories, much as a gardener propagates a rare plant from cuttings.
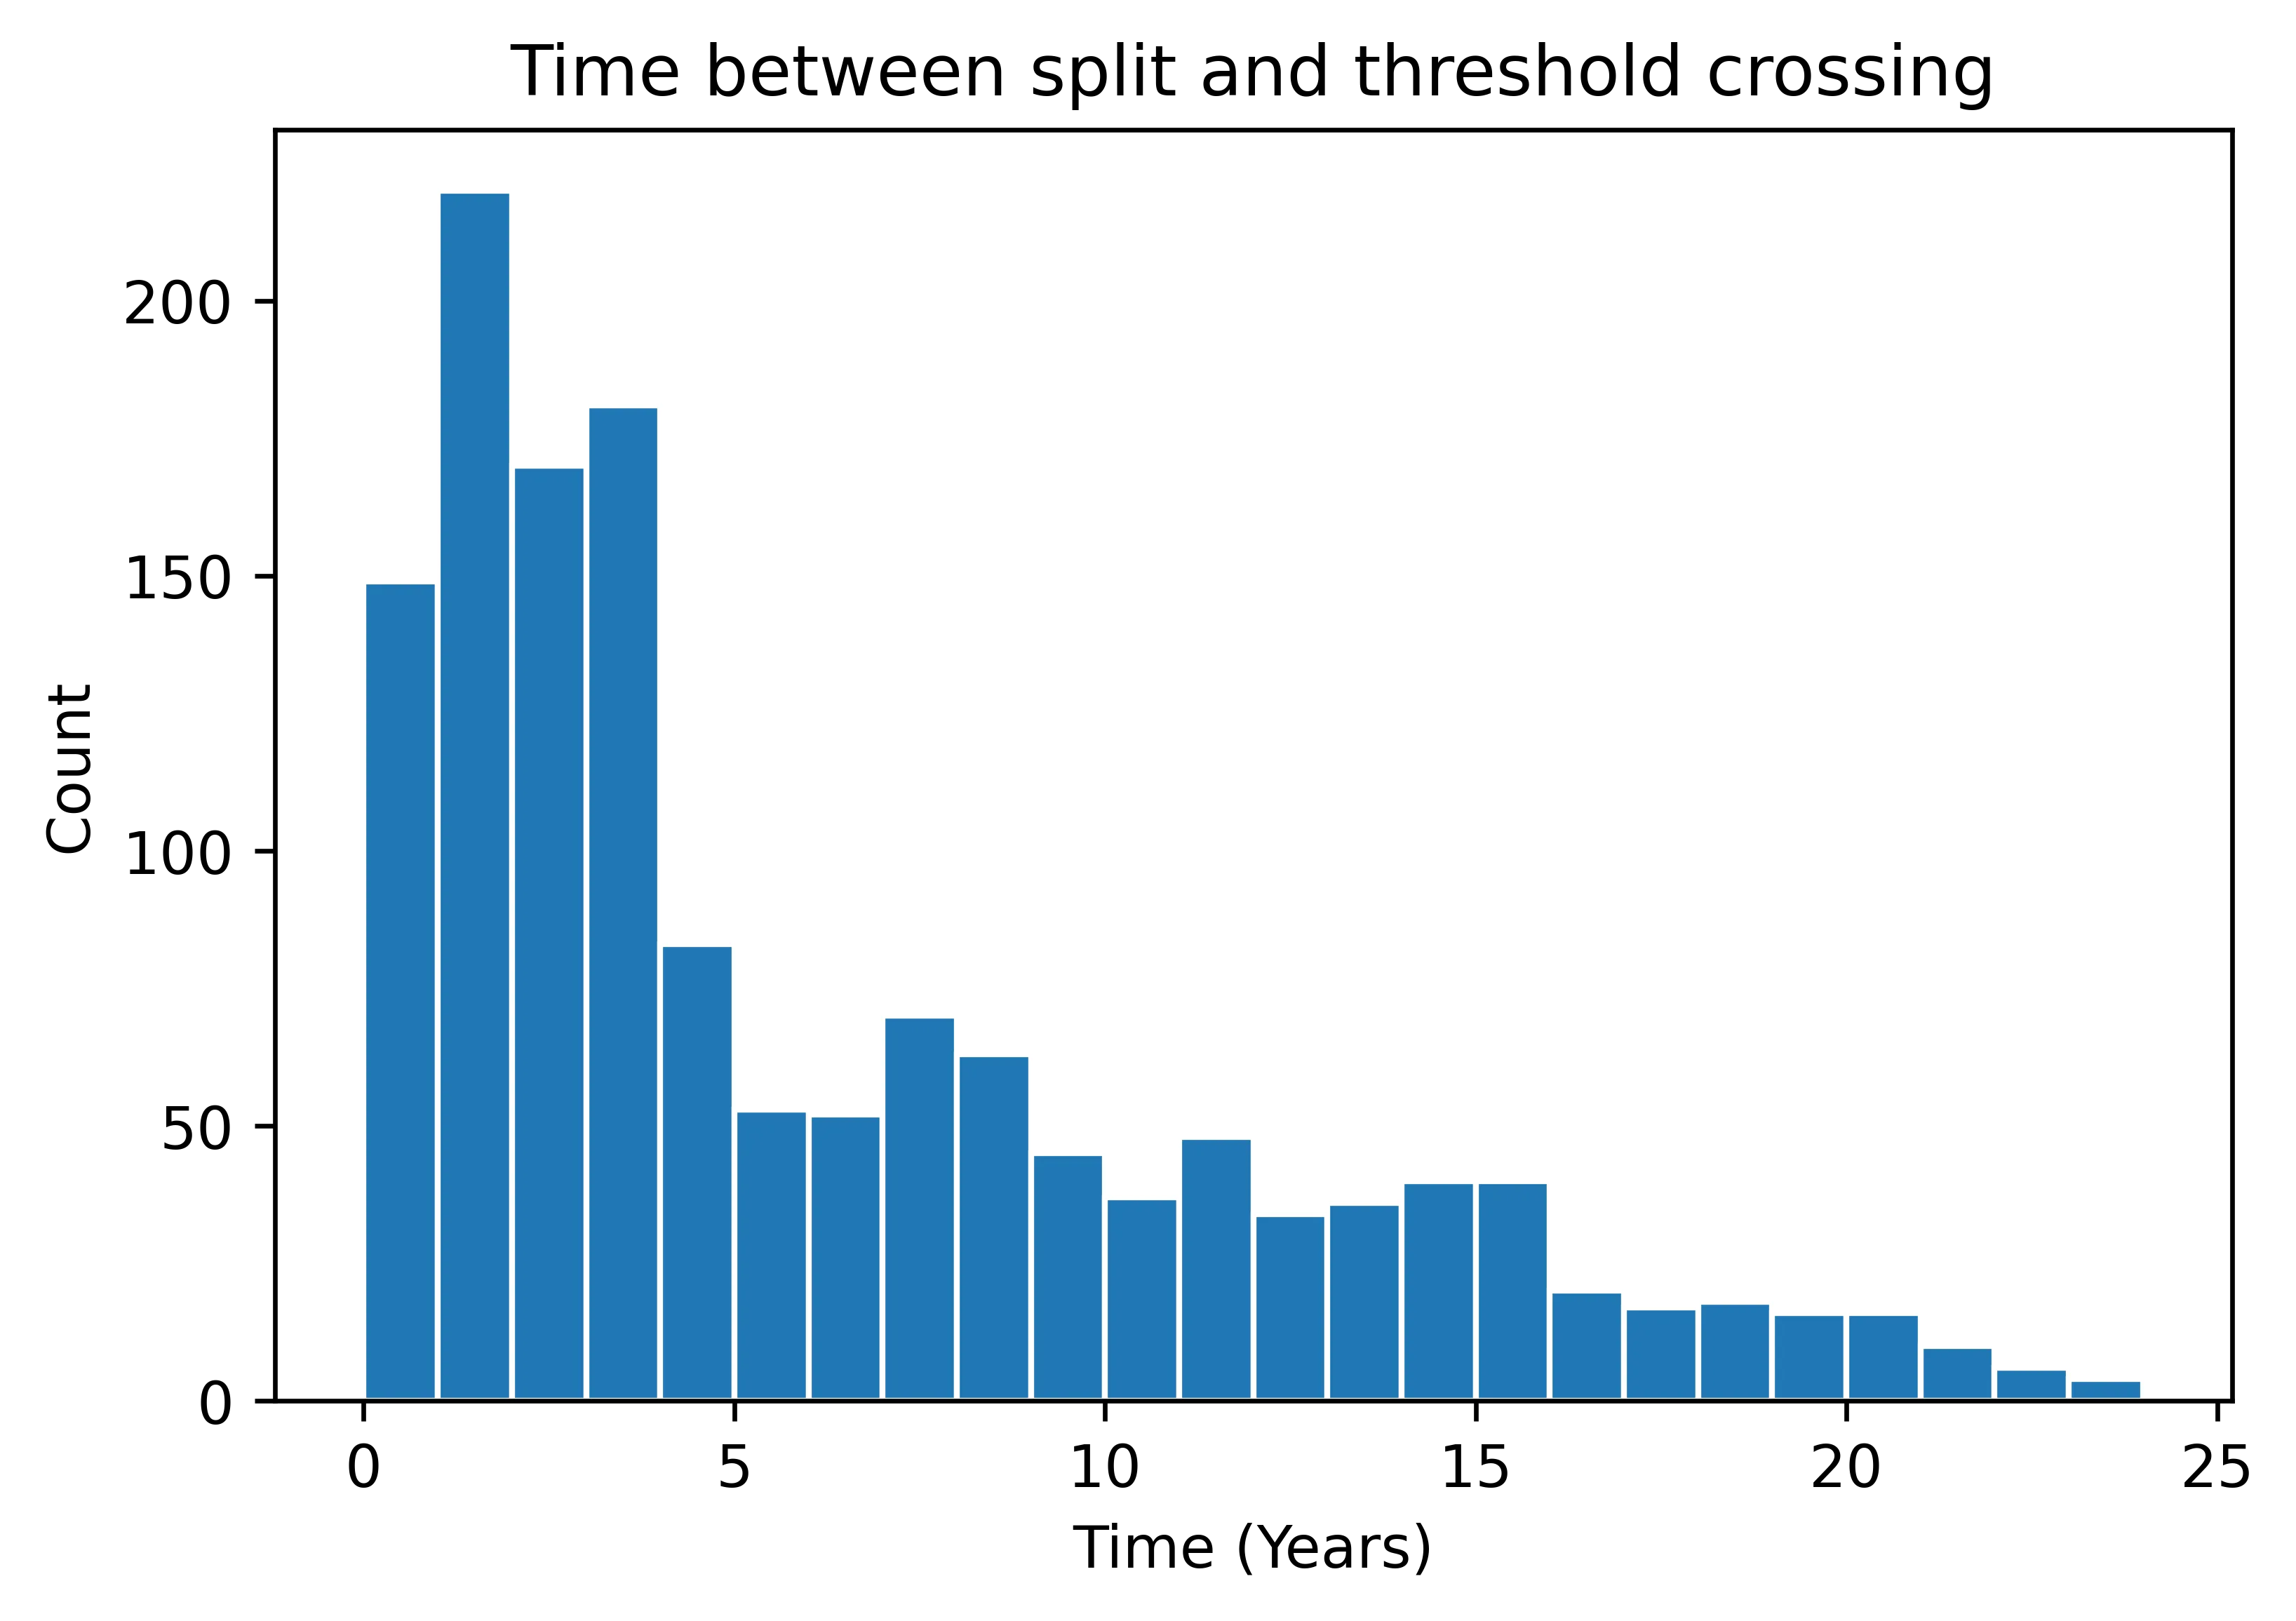
The TEAMS algorithm (Transition-Enhanced Adaptive Multilevel Splitting) works like a plant breeder. It starts with an ensemble of 16 short simulations, each 25 years long, and at each step retains only the quarter of trajectories with the highest temperature peaks in the eastern tropical Pacific. From these “parents,” it generates “offspring” by adding a tiny random perturbation to the sea surface temperature (amplitude 0.1°C) 7.5 years before the threshold crossing. The process repeats 50 times, and the total cost of all runs is 100,000 model years, five times less than the benchmark direct simulation of 500,000 years.
Comparison with the benchmark showed that TEAMS reproduces return time estimates for extreme El Niños up to 60,000 years. The distribution of block maxima, weighted by branching probabilities, matched the benchmark well, especially in the tail where the strongest events reside. Interestingly, the temperature threshold grew rapidly in the first generations but then leveled off at about 4.2°C, suggesting a possible internal limit to extremity in the model. The success rate of generating offspring that exceed the threshold was about 77%, and trajectory analysis showed that a small perturbation can first trigger a La Niña and then amplify the subsequent El Niño through non-normal growth of perturbations.
Before this work, it was unclear whether the statistics of extreme El Niños could be obtained without prohibitively long simulations. Now it is shown that the algorithm reproduces the distribution and return times in the Zebiak-Cane model at a cost five times lower than the benchmark. The trick is simple and elegant: branching trajectories with small perturbations produces offspring that more often reach extreme thresholds, and probability weights correct for sampling bias. The method can be transferred to expensive global climate models to assess the risks of rare El Niños today.
Propagating a storm from a single trajectory, which began with cuttings in 1997, now yields a whole family of extreme events ready for statistical analysis. Instead of waiting for a rare guest to knock on the door, we have learned to invite it hundreds of times and record every visit.
TEAMS' cost of 100,000 model years is equivalent to simulating climate from 1997 to about the year 102,000 CE, but achieved by branching only 50 short runs.
The idea of branching trajectories to explore rare outcomes echoes the multiverse in Ted Chiang's 'Story of Your Life', where different branches of the future are viewed simultaneously.