Color Under the Microscope Becomes a Depth Map express
Light passing through a stained cell loses some of its strength, like a flashlight beam cutting through a glass of tea. The denser the color, the more light is absorbed. But until now, a microscope could only show a flat shadow of this process, not its volume.
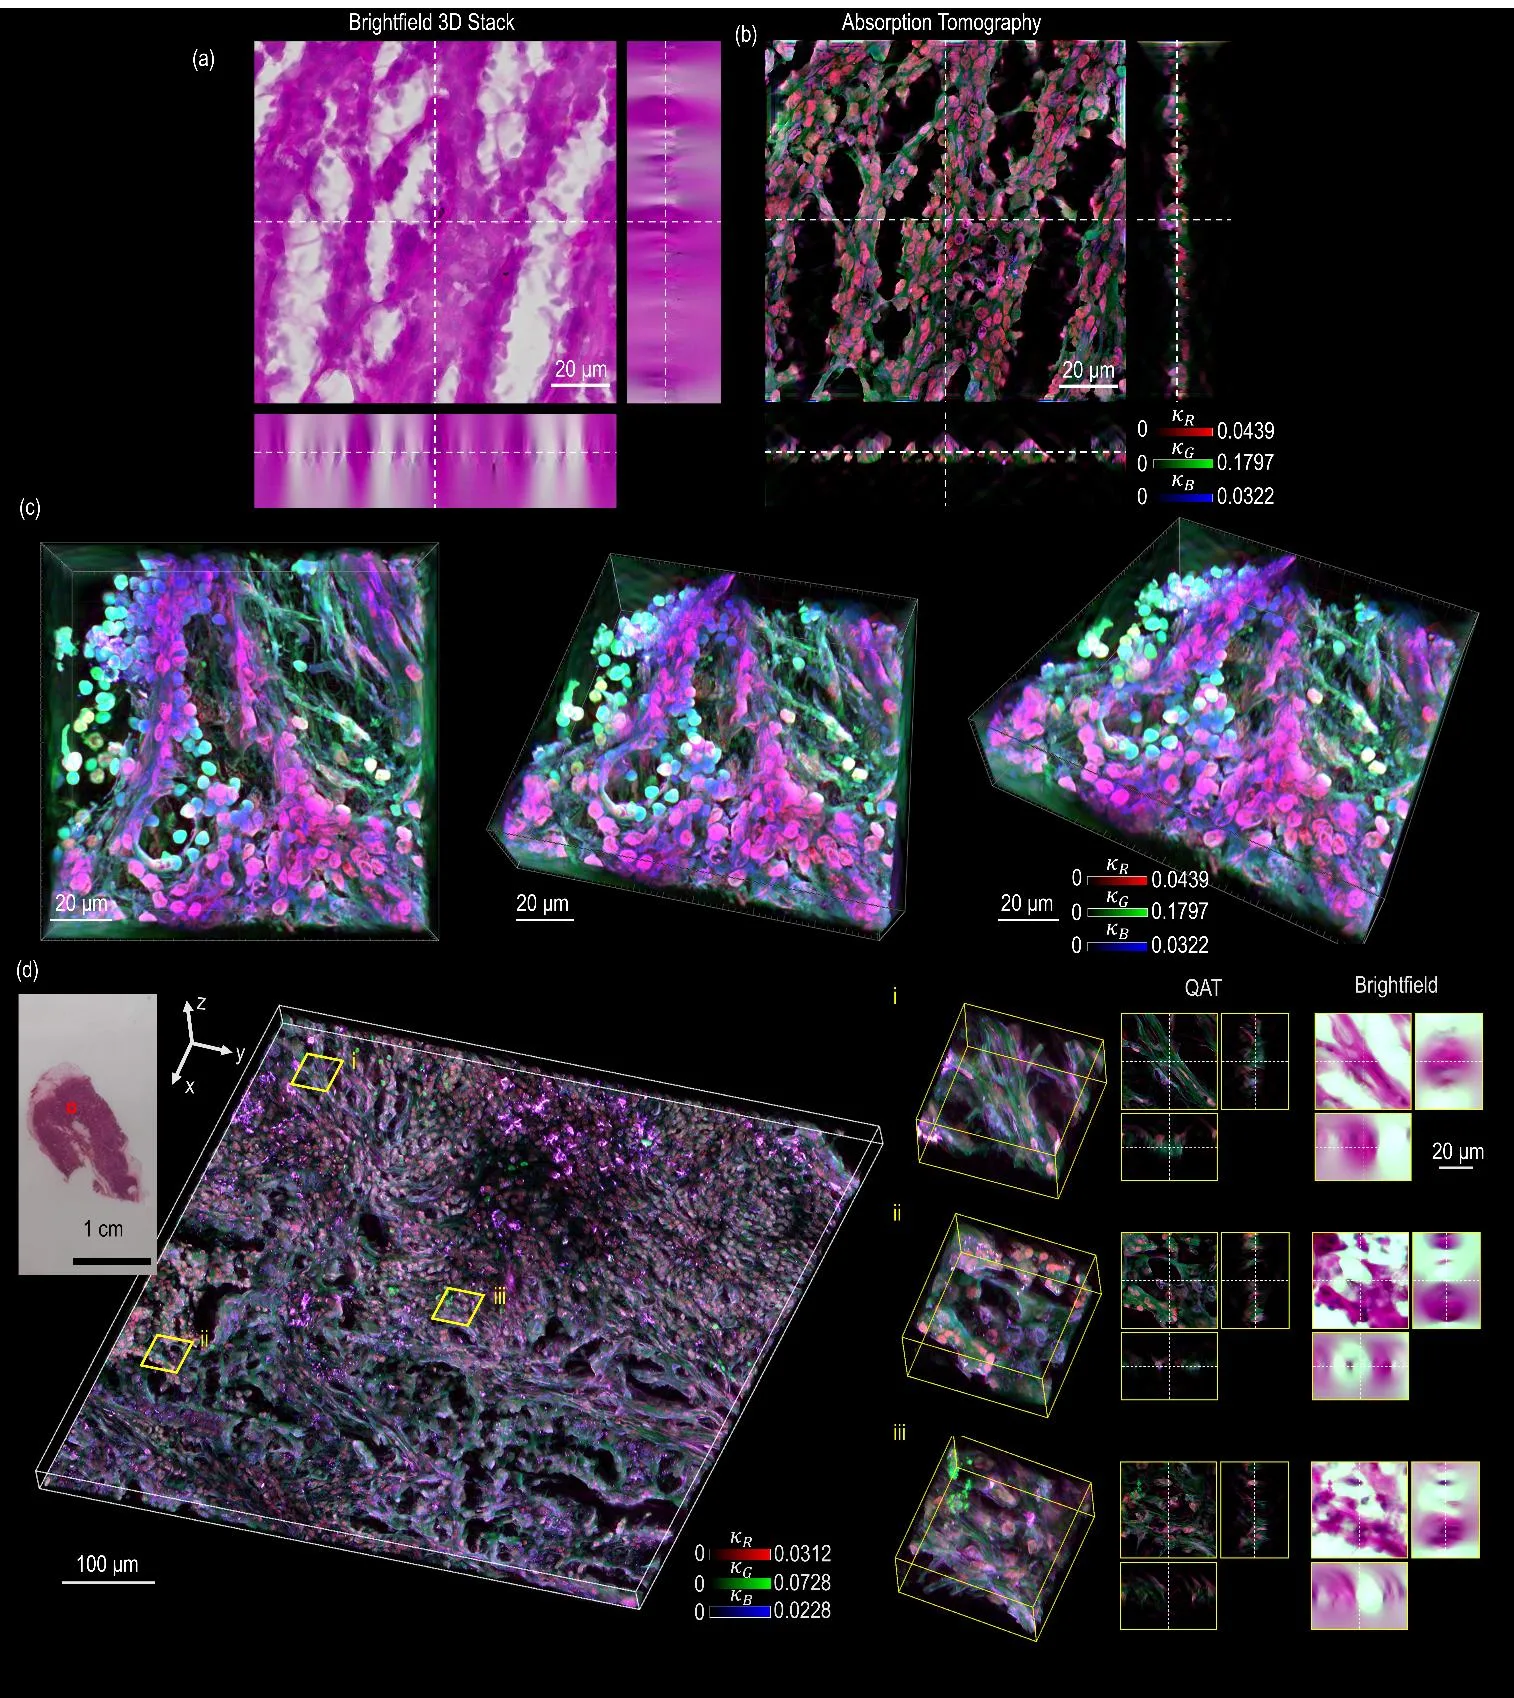
The new method takes a stack of ordinary images captured as the focus is smoothly shifted and assembles them into a three-dimensional map of how strongly each point in the sample attenuates light. No lasers, no rotating the specimen, no special labels, just a standard light microscope and math that untangles how the shadow from depth mixes with the shadow from the surface.
The same approach colored petunia petals in 3D and digitized large stained sections of human tissue that pathologists examine under a microscope. Color, once just a picture, has become a measurable quantity, like temperature or weight.
In this way, an ordinary microscope transforms from a device for looking into an instrument that sees not only shape but also substance — layer by layer, cell by cell.
Original abstract
as written by the authors arXiv:2601.15925
Optical absorption is a primary, label-defining contrast across biology, pathology, and materials science, yet three-dimensional quantitative absorption imaging has remained largely inaccessible to the brightfield microscopes used in everyday practice. We introduce quantitative absorption tomography (QAT), which recovers volumetric distributions of the extinction coefficient by treating brightfield image formation as a linear inverse problem in logarithmic intensity space and inverting a three-dimensional absorption optical transfer function. Under weak-scattering conditions, QAT yields spectrally resolved, three-dimensional absorption maps from through-focus image stacks acquired on standard brightfield platforms, without interferometry, coherent illumination, or sample rotation. We use QAT to track melanin dynamics in living melanoma cells without exogenous labels, image pigment organization in intact Petunia hybrida petals in vivo, and reconstruct chromogenic contrast across large H&E-stained human tissue volumes. By establishing absorption as a directly measurable volumetric quantity within standard brightfield workflows, QAT positions chromogenic contrast as a quantitative axis alongside fluorescence- and refractive-index-based imaging.
The pigment melanin in melanoma cells moves like grains of sand in an hourglass: the method allows you to watch this motion in real time without dyes.