Crystal Map: How to Sort Through Millions of Images express
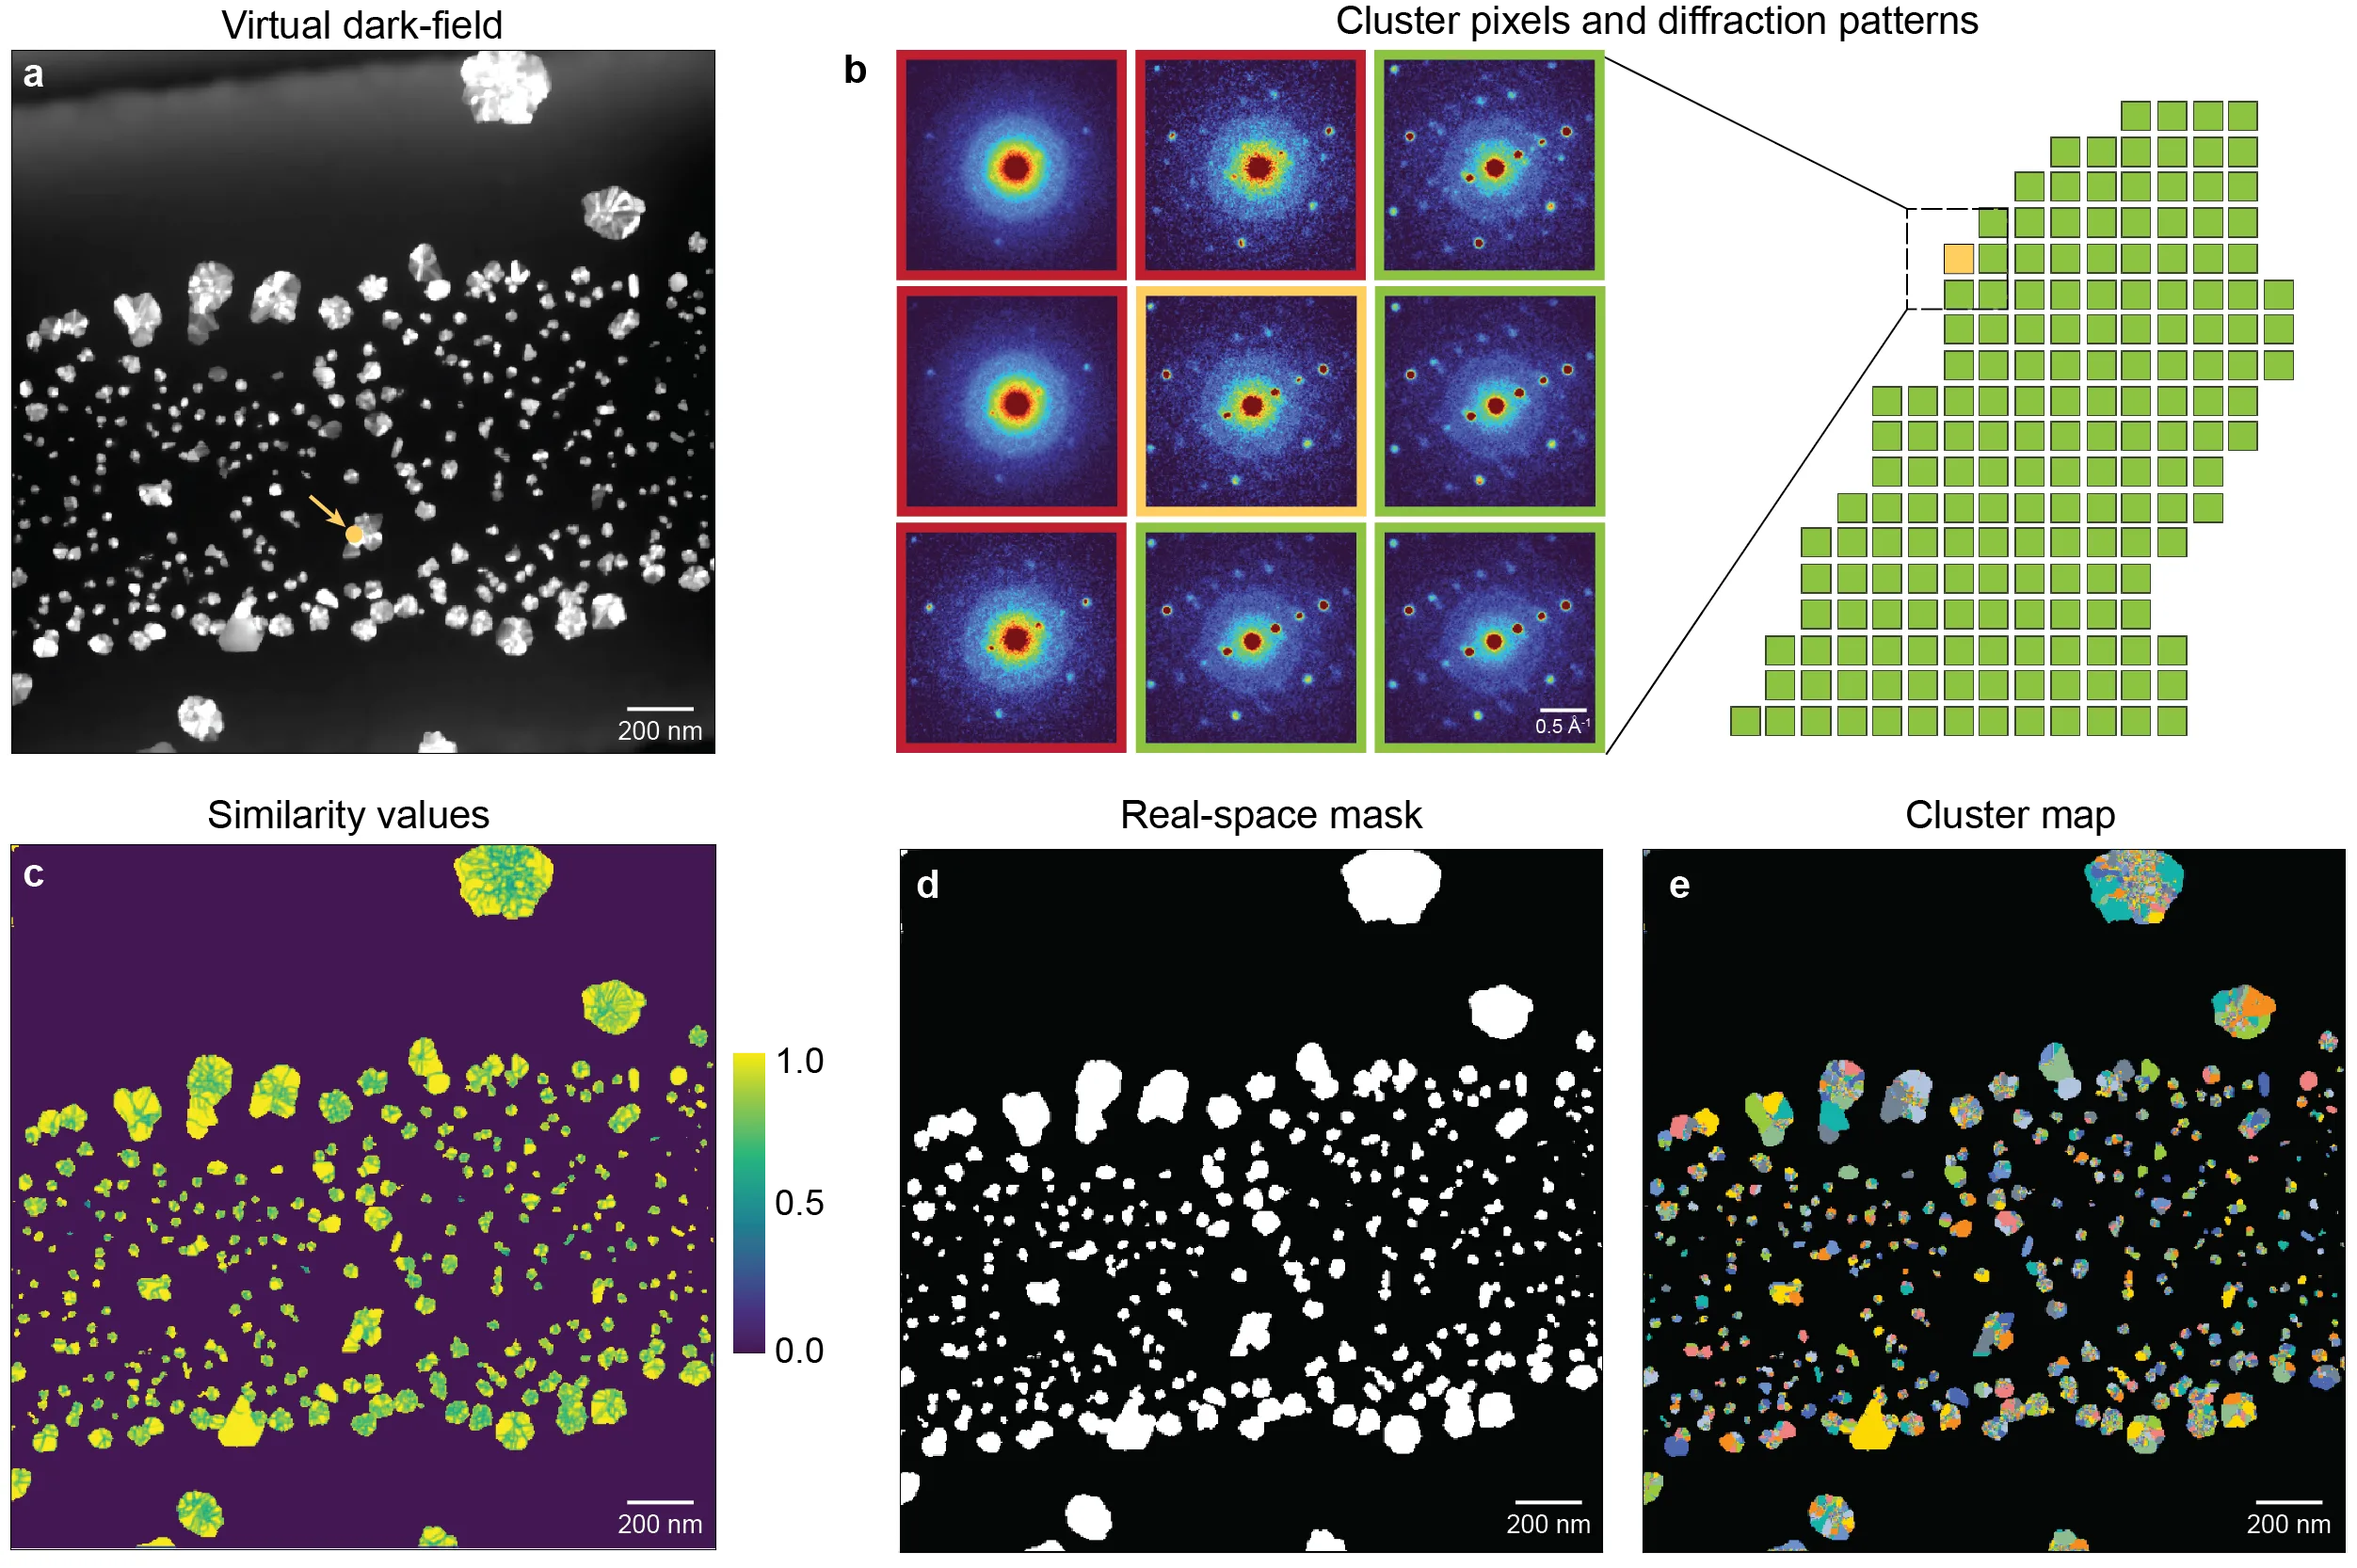
An electron microscope scans a sample and records how electrons scatter off atoms at each point. The result is a giant stack of images — one for every point. These images encode information about how atoms are arranged: in neat rows or with a tilt, the orientation of the crystal lattice, and whether there are internal strains.
The problem is that there are millions of such images, and sorting through them by hand is impossible. The authors propose automatically finding regions where the scattering pattern is nearly identical. Similar images are grouped together, and for each group, an averaged pattern is produced — sharp and noise-free. Thus, from the chaos of millions of images, a map of a few dozen regions emerges.
This approach drastically reduces data volume — by hundreds of times. Importantly, no details are lost; instead, they become more visible: averaging removes random noise. The method is useful not only for static samples but also for observing processes in real time, such as crystal growth.
The authors tested the algorithm on data from the growth of gold nanoparticles in a liquid medium. The microscope recorded video of particles coarsening, and the program classified frames on the fly by crystal packing type. This made it possible to see how each particle's structure changes individually.
Now materials scientists have a tool that turns raw microscope data into a clear map: where each phase is, how the lattice is oriented, and where strains exist. This speeds up analysis and helps uncover patterns that were previously lost in noise.
Averaging diffraction patterns improves signal quality so much that weak reflections, invisible in individual images, become apparent.