The bootstrap is a resampling technique used to estimate the uncertainty of a statistic, such as the mean, median, or regression coefficient, without making strong assumptions about the underlying distribution. It works by repeatedly drawing random samples, with replacement, from the original data and calculating the statistic for each resample. The distribution of these bootstrap estimates approximates the sampling distribution of the statistic, allowing you to compute standard errors, confidence intervals, and hypothesis tests.
History
The bootstrap was introduced by Bradley Efron in 1979. Efron developed it as a general-purpose method for estimating the accuracy of statistical estimates, building on earlier jackknife techniques. He coined the term 'bootstrap' from the phrase 'to pull oneself up by one's bootstraps,' reflecting the idea of using the data itself to infer its own uncertainty.
How it works
Given a dataset of size n, the bootstrap creates many 'bootstrap samples' by randomly selecting n observations from the original data, allowing the same observation to appear multiple times. For each sample, the statistic of interest is computed. After thousands of repetitions, the collection of these statistics forms an empirical distribution. The spread of this distribution (e.g., its standard deviation) provides an estimate of the statistic's standard error, and its percentiles give confidence intervals.
In practice
The bootstrap is used in machine learning for model validation, in ecology to estimate species diversity, in medicine for analyzing clinical trial data, and in economics for forecasting uncertainty.
Fun fact
The bootstrap can be used to estimate the uncertainty of almost any statistic, even when no analytical formula exists, making it a 'universal' tool for statistical inference.
The orchestra plays without a conductor. Each instrument follows its own schedule: the violin on Monday, the flute on Wednesday, the timpani on Saturday. Astronomers hear not music but isolated notes scattered across the calendar. A telescope sees a star only when it is above the horizon and when the schedule has allotted time for it.
Two photographers shoot the same mountain. One takes a hundred shots from the summit and only a couple from the base; the other does the opposite. If you try to align their images, the algorithm might decide that the summit in one photo matches the summit in the other simply because there are many similar points there, not because it's the same spot. Sampling density throws it off.
A glucose meter that doesn't prick your finger but just looks at your wrist: that's the dream for millions of people with diabetes. It's the promise of algorithms that extract glucose levels from the ordinary pulse signal, the photoplethysmogram (the same one that measures heart rate in smartwatches).
Holding in mind the exact position of a pen as it's slowly moved is a routine task for the brain. For artificial neural networks, it's nearly impossible. Standard recurrent networks like GRU and LSTM tend to break continuous motion into rigid steps: the pen doesn't glide smoothly but jumps from point to point.
A neural network predicts the future of a system — say, how plasma will swirl in a magnetic field or how a face in a video will change. Errors are inevitable, and the further it looks ahead, the more they accumulate. Checking against the correct answer during operation is impossible: it simply doesn't exist.
A basin of wet sand. You press in one corner, and water starts moving. But how exactly? Instead of an even circle, it might spread in tongues, linger in some spots, and rush through others. Underground, the same thing happens: oil, water, or gas migrate through rocks not by the textbook, but following the chaos of fractures and heterogeneities.
The optical sky background is a cosmic palimpsest, where light from billions of unresolved galaxies is layered, each layer corresponding to a different epoch. Until now we could only distinguish the brightest "letters"—individual stars and nearby galaxies.
Imagine a fleet of many ships, resembling a galaxy — a vast stellar system where every element follows the overall dynamics. From time to time, one ship breaks down, exploding like a supernova — a catastrophic event that can disrupt the integrity of the entire formation. If the damaged unit isn't replaced in time, the fleet loses combat capability.
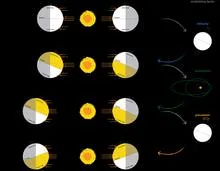
Gravitational microlensing is a fascinating cosmic effect predicted by Einstein and developed by Zwicky. A massive body passing between us and a distant star bends its light like a lens, creating characteristic magnifications and distortions.
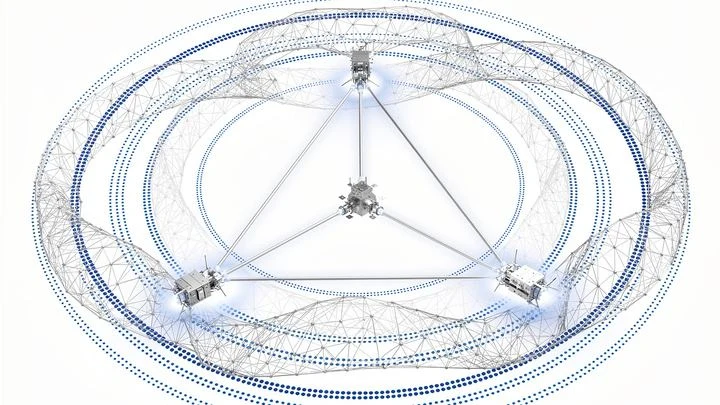
The Universe is not silent: it is filled with a continuous gravitational-wave hum. In a decade, the LISA space observatory will tune its "ears" to the millihertz range, and the richest source will be our Galaxy — tens of thousands of white dwarf pairs whirling in a frantic dance.
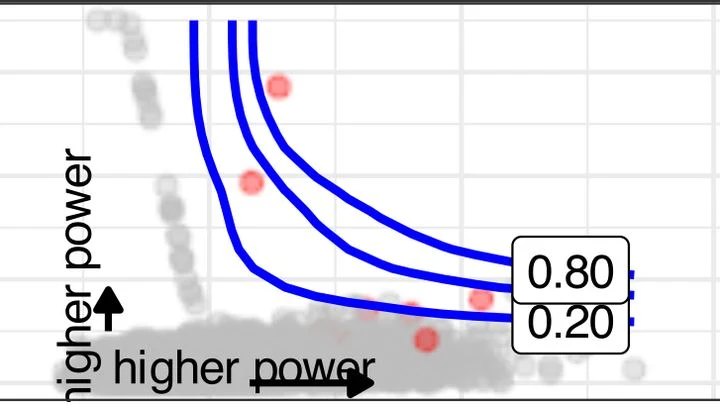
When you're planning a renovation, you don't buy paint by eye: you measure the wall area. In science, deciding how many samples to collect is a similar guess, but the stakes are higher. Skimp on samples, and your study becomes a lottery: you might miss a real effect, or you might mistake noise for a discovery. Overshoot, and you're wasting tubes, months, and, in animal experiments, lives.
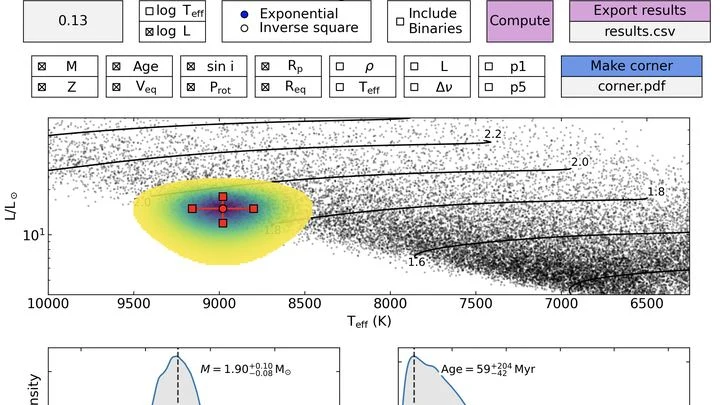
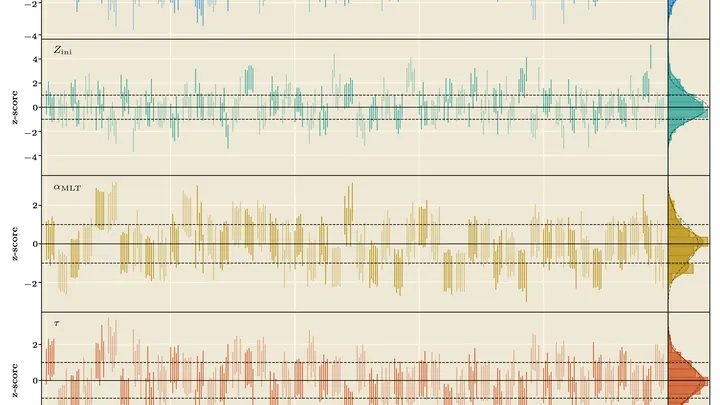
Imagine a person in an old photograph standing in a crowd while spinning — guessing their age would be nearly impossible. That's roughly how astronomers determine the ages and masses of distant stars, and they often get it wrong. For stars slightly heavier than the Sun (from 1.4 to 2.5 solar masses), standard methods like chemical-composition 'clocks' work poorly.
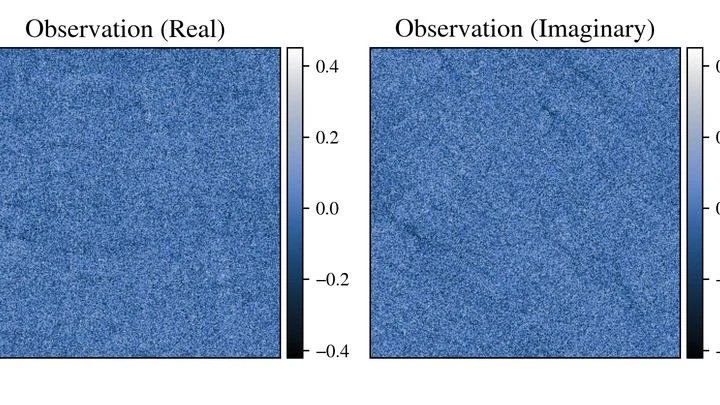
A camera takes a snapshot, but the sensor is noisy, the optics blur, and some pixels are overexposed. Reconstructing the original picture is like guessing a melody from a scratched record: there are many possibilities, and which one is true is unclear.
Each heartbeat can be drawn as a point on a sheet of paper. Thousands of these points merge into a cloud. The Mapper algorithm turns this cloud into a network: it connects points that behave similarly and colors them according to blood flow strength. The result is not just a pile of numbers but a colored map showing which parts of the heart work in sync and which are out of step.
The scale tells you your weight, but it's silent about where those pounds sit — in muscle or belly fat. And it's the fat tucked deep inside, around your organs, that's most often linked to heart disease and diabetes. Previously, you could only see it with an expensive scanner at a clinic. Now, a smartphone is all you need.
A dense social network: everyone is connected to almost everyone else, and in this web it's hard to see who really matters. Too many threads — computers choke, simulations stall. Scientists have figured out how to prune such networks without losing what's essential.
The idea is to remove connections that don't participate in shortest paths.
Light born at the moment of the Big Bang has traveled to us for almost 14 billion years. But along the way, it passed through the gravitational fields of galaxies and clumps of dark matter, which bent its rays. To an observer, this looks like an image stretched and smudged by an old window pane.
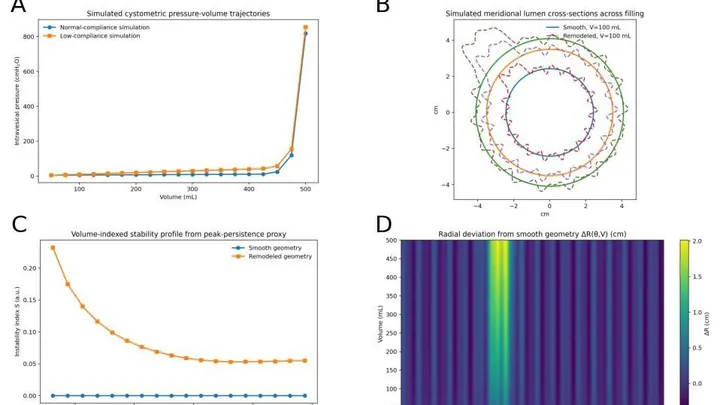
The bladder is like a balloon: as it fills, the wall stretches and the shape changes. Doctors usually monitor the pressure inside and how much fluid has entered, but they rarely look at the geometry itself — how the surface curves. Yet irregularities can appear before the usual metrics deteriorate.
A charged particle spiraling in a magnetic field doesn't stay silent: it emits light. This light is called synchrotron radiation, and it shows up everywhere — from distant galaxies to laboratory accelerators.
Our body's tissue is like a city: different neighborhoods are home to different cells, each with its own job. To understand how this city is organized, biologists take images showing which genes are active at each spot. But sharp images are expensive, and cheap ones come out blurry, like a photo of a city from high above, where individual buildings are hard to make out.
Imagine a photographer shooting a tall building, but instead of a single frame, they take a series of shots while moving the camera in a spiral from top to bottom. This approach captures more detail in less time, but the images can come out blurry. A similar challenge faces MRI machines when they need to quickly image the brain.
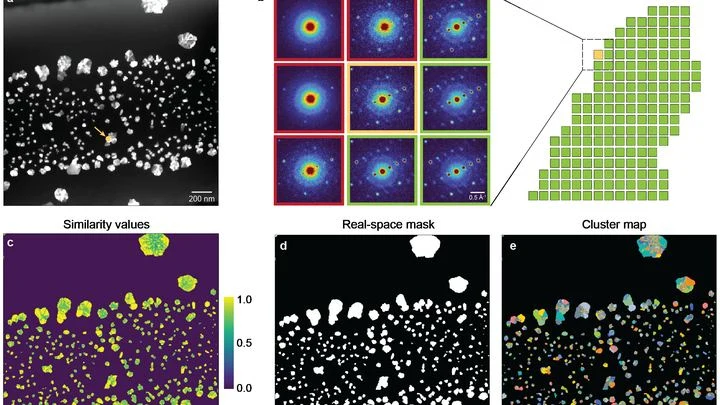
An electron microscope scans a sample and records how electrons scatter off atoms at each point. The result is a giant stack of images — one for every point. These images encode information about how atoms are arranged: in neat rows or with a tilt, the orientation of the crystal lattice, and whether there are internal strains.
Genetic diagnostics is like comparing two photos taken with different cameras. If one camera slightly shifts the colors, the image will show "defects" that don't exist in reality.
A star trembles like a bell after being struck. These tremors, tiny fluctuations in brightness and surface, can be caught by a telescope. From the frequencies of these 'stellar notes,' astronomers infer what's happening inside: how old the star is, how it's structured.
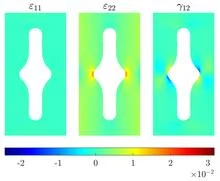
A mechanical testing lab is like a kitchen where a chef tastes a dish to guess the recipe. For an anisotropic material, one that is stiffer along its fibers than across them, a single taste is not enough. You need three or more separate tests, each with its own specimen. Engineers have spent years refining specimen shapes by hand, relying on intuition and experience.
A translator who learns to correct their own slips works more accurately. In the world of forecasting noisy processes, a new method takes on this role: a reservoir computer that adds a random correction to its prediction at each step.
Imagine an interpreter who gets distracted by every rustle in the hall. The more rustles, the more errors in the translation, even though the meaning of the speech hasn't changed. The same happens with data: if measurements are unevenly spaced, standard analytical tools start "hearing" changes that never occurred in the underlying process.
A translator who jumps at every rustle in the hall starts mixing up words by the end of the meeting. Their confidence in being right grows, while their accuracy drops. That is roughly how poorly calibrated probabilistic forecasts behave: the model claims a high probability for an event, but reality disagrees.
The barometer in the port of Papeete on Tahiti and the one in Darwin, Australia, are separated by 7,400 kilometers. When one shows high pressure, the other often shows low, and this difference, called the Southern Oscillation, drives rainfall from India to Brazil. Predicting it even a month ahead is a problem with a century-long history.