Why rivers ignored the barometer: the secret was in the thermometer
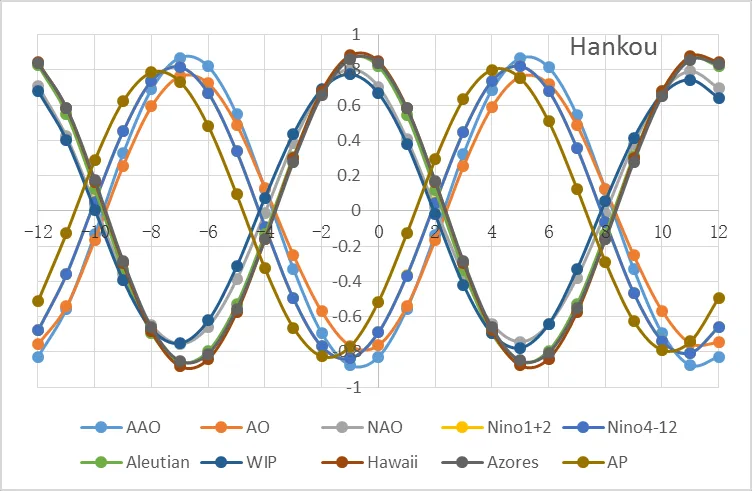
For a hundred years, climatologists measured the ocean's pulse with a barometer, but they should have used a thermometer. Indices like El Niño are built on the atmospheric pressure difference between two points, but rivers barely respond to that. The authors of the new study simply subtracted the average temperature of one ocean region from the average temperature of another, and the correlation with river runoff jumped to 0.8–0.9. For the Bangui station on the Ubangi River, the correlation reached 0.91, which is almost a perfect match.
The most surprising part: the strength of the ocean–river link changes every six months, exactly mirroring how Earth moves closer to and farther from the Sun. This suggests that climate is driven not only by what happens on Earth but also by the planet's orbital motion. If this holds up, river floods could be predicted years in advance, knowing only the distance from Earth to the Sun.
The correlation between sea surface temperature near the Aleutian Islands and the runoff of the Indus River at Darband station reaches 0.911, comparable to the correlation between air temperature and the boiling point of water in a single kettle.