An Ocean Thermometer Instead of a Barometer: A Fresh Take on Climate Indices
Context
Since the 1920s, indices for large-scale atmospheric oscillations such as El Niño, the North Atlantic Oscillation, and the Arctic Oscillation have been computed from standardized pressure differences or sea surface temperature anomalies. These indices explain physical mechanisms well, but their correlation with local hydrological data remains disappointingly low, typically in the 0.1–0.2 range. Neighboring papers in the archive also explore the connection between ocean oscillations and climate or hydrology, but they do not question the definition of the indices themselves via non-standardized temperature differences. This work stands out: it proposes abandoning nonlinear standardization and using raw temperature differences, which dramatically changes the correlation picture.
Methods
The authors use global sea surface temperature (SST) data at 2°×2° resolution from 1854 to 2010 and monthly runoff data for seventy rivers worldwide from 1866 to 2001. For each classic index (SOI, NAO, NPO, AO, AAO, IOD, and others), they identify key regions and compute the difference in mean sea surface temperatures (SSTD) between them without any standardization. They then perform correlation analysis for each index–runoff pair with lags from −12 to +12 months to account for hydrological response delays. Additionally, they compare the resulting series with the Earth–Sun distance and compute correlations between runoff and temperatures in specific regions such as the Aleutian Islands, Hawaii, and the Azores.
Results
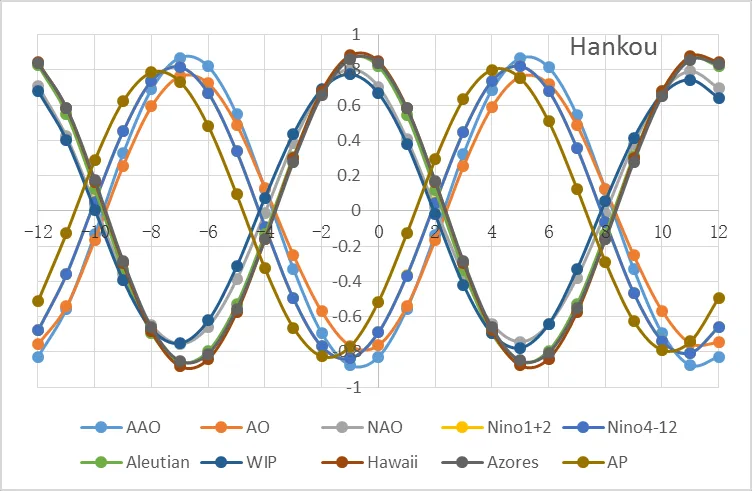
Redefining indices via SSTD leads to a sharp increase in correlations with river runoff. For example, at Hankou station on the Yangtze, the correlation coefficient with ENSOSSTD reaches 0.79, and with Nino1+2 SST it is 0.84. At Bangui station on the Ubangi River, the correlation with AAOSST reaches 0.91. Overall, across the seventy stations, most new indices yield correlations above 0.5, often above 0.8, whereas classic indices rarely exceed 0.3. The authors also find that correlations between runoff and SSTD in individual regions (Aleutian Islands, Hawaii, Azores) also exceed 0.8. Moreover, the time series of correlations exhibit a clear six-month cycle that matches the cycle of Earth–Sun distance variation. This leads the authors to conclude that the common driver is Earth's orbital motion, not internal climate system processes.
Implications
The work shows that the low correlations of classic indices with hydrological data are an artifact of standardization, not a property of the climate system itself. This challenges the widespread practice of using standardized indices for quantitative forecasting. Unlike neighboring studies that retain standardized definitions and seek new regions or analysis methods, this work proposes a fundamentally different approach: using raw temperature differences. This achieves correlations sufficient for quantitative analysis and points to an astronomical, rather than internal, source of variability. If confirmed, this conclusion would require revising many climate models.
Future development
If the link between Earth–Sun distance and ocean temperature contrasts is indeed causal, it opens the possibility of accurately calculating SST and SSTD decades and centuries ahead. This could solve the problem of long-term and ultra-long-term climate and hydrology forecasting. Further research could test this hypothesis with independent data and climate models, and search for the physical mechanism linking orbital parameters to oceanic processes. It may also be necessary to reconsider the role of solar activity and tidal forces in climate variability.
Impact
The results could affect hydrological forecasting, water resource management, agriculture, and fisheries, since the proposed indices provide much higher correlation with local conditions. They could also change approaches to climate modeling and the interpretation of paleoclimate data.
Next steps
The analysis needs to be reproduced on independent datasets, including modern satellite measurements of sea surface temperature, and the stability of correlations over time must be checked. It is also important to investigate the physical mechanism linking Earth's orbital motion to ocean temperature contrasts, possibly through tidal effects or changes in solar insolation.
Key open problems
This work directly addresses a fundamental problem in hydrology and climatology: why large-scale climate indices correlate weakly with local hydrological records. The authors show that the problem may lie in mathematical processing rather than physics, opening the way to more accurate forecasts. It also touches on the question of external drivers of climate variability, which remains debated.
The correlation between sea surface temperature near the Aleutian Islands and the runoff of the Indus River at Darband station reaches 0.911, comparable to the correlation between air temperature and the boiling point of water in a single kettle.
Key numbers
- maximum AAOSST correlation with runoff: 0.91
- typical correlation of classic indices: 0.1–0.2
- number of hydrological stations: 70
- SST data period: 1854–2010
- maximum lag in correlation: ±12 months