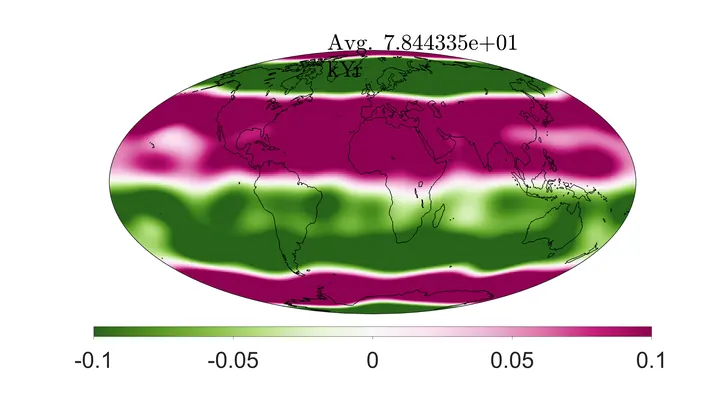
Sea surface temperature anomaly is the difference between the current temperature of the ocean's top layer and the average temperature for that same location and time of year, calculated over a long reference period (typically 30 years). A positive anomaly means the ocean is warmer than usual; a negative one means it is cooler. Because the ocean stores and releases enormous amounts of heat, these deviations are among the most sensitive indicators of the planet's energy balance and climate state.
History
The concept emerged in the mid-20th century as oceanographic monitoring expanded, but it became a standard tool with the advent of satellite remote sensing in the 1970s and 1980s.
How it works
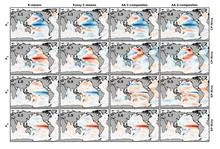
Scientists compile satellite and buoy measurements of ocean surface temperature, then subtract the climatological average for each grid cell and month. The result is a map of warm and cool patches. These anomalies are not random noise: they often form coherent patterns that persist for months or years, such as the warm tongue across the equatorial Pacific during El Niño. Tracking anomalies over time reveals both short-term variability and long-term warming trends.
The cosmological debate is like two craftsmen measuring the same wall but getting different lengths. One uses a tape measure, applying it to nearby landmarks — Cepheids (pulsating beacon stars) and Type Ia supernovae (flashes of dying stars). He finds the wall is stretching at 73.5 arbitrary units.
Earth's magnetic field is like an invisible shield that protects us from cosmic radiation. But if you look closely at its long-term averaged pattern, you'll notice that this shield isn't perfectly smooth: it has its own "seams" and "patches." New research using computer simulations of the geodynamo shows that…
In the deep oceans of icy moons, water is not still. Warm plumes rise from the rocky seafloor, but the planet's rotation twists them into long, slanted rolls stretched along the rotation axis. Previously, this process could not be included in global models: it was too complex.
A tuning fork produces a pure tone, but if you strike it too hard, it starts to rattle, and a musician might mistake that rattle for complexity in the sound.
In the Pacific Ocean, there is a warm current that flows eastward against all the others. It is called the North Equatorial Countercurrent, or NECC. In normal years, this band of warm water, a few hundred kilometers wide, quietly carries heat from Indonesia toward the Americas.
A lump of sugar drops into hot tea, a spoon stirs a few times, and the sugar disappears. But how exactly does it spread through the churning liquid? Physicists have peered into this process with unprecedented detail: they simulated turbulence on a grid of 8192³ points. If you were to split every millimeter of the cup into a hundred cells, you'd get a similar resolution.
Plutonium is a metal with attitude. One form shrinks when cooled, another swells. But at room temperature, the alloy behaves strangely: the ruler says one thing, X-rays say another. The ruler shows the sample barely grows, while X-rays see atoms in the crystal lattice moving further apart.
Beneath Enceladus's icy crust churns an ocean, acting like a perfect heat pump. It pushes heat from the equator to the poles, spending a thousand times less energy than it transports — like a perpetual motion machine built into the moon. The secret lies in salt.
In summer, the Arabian Sea breathes like a pair of bellows: one moment it pumps heat, the next it exhales moisture over a billion people. But sometimes this breathing stumbles, and the water off the coasts of India and Pakistan runs a few degrees hotter than usual.
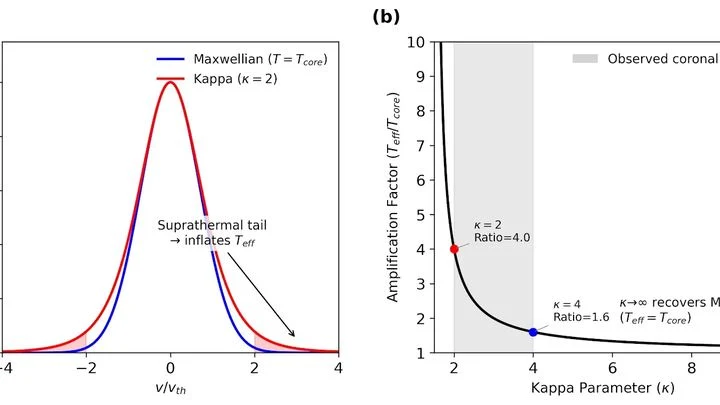
For eight consecutive years, two different methods of measuring the temperature of the solar corona have given different answers. One instrument, a radio telescope in Nancay, sees 600 thousand degrees. The other approach, calculating from how the gas is distributed with height, requires 1.5 million.
Astronomers observed seven times how a black hole tears apart a passing star. They measured the flares with high precision in X-rays and noticed: the more energetic radiation always outpaced the soft by 500 seconds. It's like a sound echo in the mountains — first you hear the direct shout, then its reflection off a cliff.
An exoplanet — a planet outside our solar system — follows a slightly elongated orbit. With each revolution, it swings closer to its parent star and then farther away.
A camera on a tripod shoots the same landscape for decades. If you don't touch the lens, the images get hazy: the landscape changes, but the focus stays put. That's roughly how climate norms work. According to World Meteorological Organization rules, they are calculated as the average over the last 30 years.
An orchestra of two musicians plays from the same score, but each hears only their own line. The atmosphere and ocean in a climate model resemble such a duet: they exchange heat and moisture every few hours, yet until recently their neural network counterparts could not keep a common rhythm.
The ocean hums like a crowded hall: in one corner, voices argue about decades; in another, about years; in a third, about the changing seasons. To pick apart these voices, climatologists used to rely on filters they tuned themselves, letting through only slow waves or only fast ones. But the Pacific plays by its own rules: a warm patch off the coast of Peru can be a brief spike or part of a long-term rearrangement.
In summer, the South China Sea can show a strange pattern: the water in the north warms while the south cools at the same time. A year later, it's the opposite. This isn't random; it's a steady seesaw that the ocean rocks every summer.
Imagine an interpreter in a huge hall who hears not only the person next to them but also a whisper in the far corner, and from those fragments reconstructs the entire conversation. That's how the CAS-Canglong neural network works: it picks up connections between pressure, wind, and heat across the whole planet and uses them to predict what the ocean will look like three months from now.
An artist painting the ocean does not limit themselves to two colors: warm and cold. Likewise, climatologists studying El Niño increasingly speak of a whole palette of shades. El Niño is a warm current off the coast of Peru that, every few years, alters weather across the planet. Its counterpart, La Niña, brings cold.
In the summer of 2023, thermometers around the world registered numbers that even the boldest forecasts had not anticipated. The planet's average temperature rose to 1.48°C above pre-industrial levels, a jump of 0.17°C that broke the previous record as if the climate had suddenly shifted gears.
Water remembers. Every current, every eddy, every degree of temperature in the ocean's depths does not vanish without a trace; it leaves a mark that can be read. But until recently, that mark was read only by bulky physical models that spent weeks on supercomputers and still got the details wrong.
Every year, over the semi-arid belt south of the Sahara, the sky stages the same play: gentle rains that nourish millet, and violent downpours that wash away villages. Until recently, both acts were attributed to a single conductor: ocean surface temperature. But if you listen closely, each rain has its own control panel.
Picture an orchestra where each instrument plays at its own tempo: violins speed up, woodwinds slow down, and percussion keeps losing the beat. That's roughly what Earth's climate looks like, with the ocean, the Sun, volcanoes, and human activity pulling temperature in different directions.
In 1982, fishermen off the coast of Peru found their nets empty, while on the other side of the Pacific, in Australia, drought set in. That was the first time El Niño made itself loudly known: a warm current that, every few years, turns the world's weather upside down.
An interpreter at a negotiation hears not only the volume of the voice but also the shift in topic. Climatologists have long listened only to volume: the average temperature. If it rises, the planet is warming. But behind the average hide events that matter more than the trend: heat waves, cold snaps, sudden changes.
A doctor who has followed the same patient for years learns to predict flare-ups from subtle signs: a slight pallor, labored breathing, restless sleep. The ocean is just such a complex patient, only instead of a thermometer it has thousands of buoys and satellites, and instead of a medical history, seventy years of daily measurements.
The orchestra of world weather is playing a tune we didn't expect. The first violin is not carbon dioxide but chlorofluorocarbons—gases that until recently hid in refrigerators and aerosol cans. They trap heat ten thousand times more effectively than CO₂, and for decades they have been quietly warming the planet.
An interpreter at an important negotiation keeps a draft of their speech at hand but checks against the live conversation as they go: if what is said diverges from the prepared text, they adjust the translation on the fly.
A farmer in Iowa looks at the calendar: plant now or wait? In a month, a heat wave might strike, or rain might set in. Forecasters throw up their hands: the two-week forecast still holds, the seasonal one is out of reach, and in between lies a gap. The atmosphere changes too quickly to remember yesterday, and the ocean is too slow to come to the rescue.
From 1955 to 1979, the extent of Antarctic sea ice shrank by 23% in winter and 67% in summer, then partially recovered. This is like a spring that was slowly compressed and then released: the climate of the Southern Hemisphere responded with a delay of several decades.
It takes eight years for a wave to circle Antarctica. It carries warmth and cold in turn, and sea ice advances and retreats with its crests. Previously, researchers caught this wave using different methods and saw either a propagating signal or a frozen dipole. Now it's clear: the dipole is just a snapshot of the wave when it stretches between two oceans.
For a century, climatologists have measured the ocean's pulse with a barometer. Indices like El Niño or the North Atlantic Oscillation are built on atmospheric pressure differences between two points, and then we wonder why rivers don't obey.
Two pendulums hang from the same wall, with a spring stretched between them. Each on its own can swing or stay still, but connect them and a shared dance begins: one nudges the other, and oscillations spread through the whole setup.
That's how the Pacific Ocean works, where two neighboring regions exchange heat through waves.
The river that circles Antarctica does not flow in a single channel: it sometimes splits into branches, sometimes merges into one stream. That is what the fronts of the Southern Ocean look like on maps built from satellite data on sea surface height. Previously, these fronts were sought along lines of equal water level, and they seemed to creep slowly southward.
The planet's winds are not free-flowing currents but rather obedient jets that can be nudged from an unexpected direction. The ocean surface, covered with waves, acts like a tuning knob: change its roughness, and giant air rivers shift by hundreds of kilometers.
Ocean temperatures did not rise like water filling a bathtub; they rose like a person climbing stairs: two broad steps upward, with waves of natural variability lapping around them, advancing and retreating. The first step occurred in 1925/26, the second in 1987/88.