An Ocean Thermometer Instead of a Barometer: A New Take on Climate Indices
For a century, climatologists have measured the ocean's pulse with a barometer. Indices like El Niño or the North Atlantic Oscillation are built on atmospheric pressure differences between two points, and then we wonder why rivers don't obey. The correlation with river runoff hovers around 0.1–0.2, which is almost none. The authors of a new study propose switching instruments: instead of a barometer, use a thermometer, and measure not pressure but the sea surface temperature difference in the same regions.
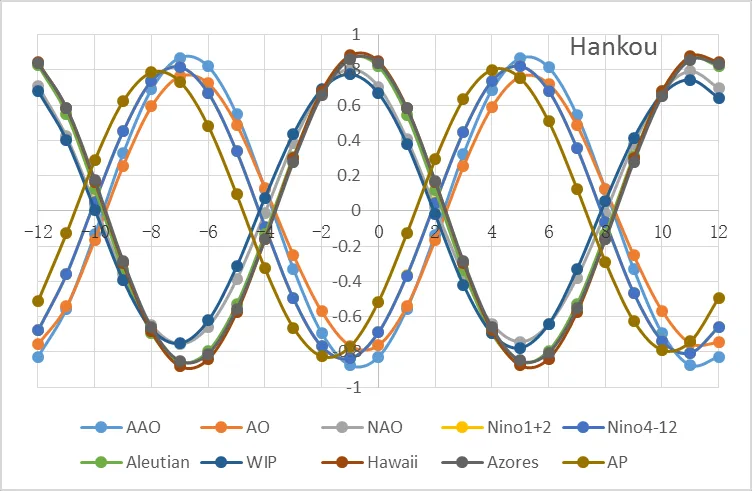
The difference turns out to be decisive. Classic indices go through a nonlinear standardization that eats away the physical signal. If you simply subtract the average temperature of one ocean region from that of another, the link to river runoff soars. For the Hankou station on the Yangtze, the correlation with the new El Niño index reaches 0.79, and for the Bangui station on the Ubangi River with the Antarctic Oscillation index, it's 0.91. For comparison: the correlation between air temperature and the boiling point of water in a kettle is close to one, but 0.9 for climate series is almost a perfect match.
The authors tested the new indices against data from seventy rivers worldwide over a century and a half. Almost everywhere, correlations jumped above 0.5, often above 0.8. But the most intriguing finding emerged when they overlaid the correlation time series on Earth's orbital parameters. It turned out that the strength of the ocean–river link varies with a six-month period, exactly mirroring the cycle of the Earth–Sun distance.
This means the common driver of climate oscillations lies not within the ocean–atmosphere system but in space. Earth alternately approaches and recedes from the Sun, and this rhythm sets the ocean's temperature contrasts. If the hypothesis holds, climate and river runoff could be forecast decades ahead, knowing only orbital mechanics.
The practical benefits are obvious: hydrologists gain a tool for accurate flood and drought forecasting. Farmers could plan sowings, and city services could prepare for high water. But the main thing is a step toward understanding that Earth's climate system is not closed; it breathes in time with the planet's motion around its star.
The correlation between sea surface temperature near the Aleutian Islands and the runoff of the Indus River at Darband station reaches 0.911, comparable to the correlation between air temperature and the boiling point of water in a single kettle.